Stay ahead with the latest from Old Well Labs
Get product updates and insights delivered straight to your inbox.


In March, we continued improving OWL’s analytics, usability, and data quality, with a focus on helping allocators better evaluate managers and monitor activity across portfolios.
We launched a new feature that shows how managers’ performance (based on OWL estimates) compares to the performance of an equal-weighted portfolio of the same positions. This analysis helps assess whether managers are adding value through position sizing decisions. This view is available on the “Sizing Skill” view of each manager profile and includes:
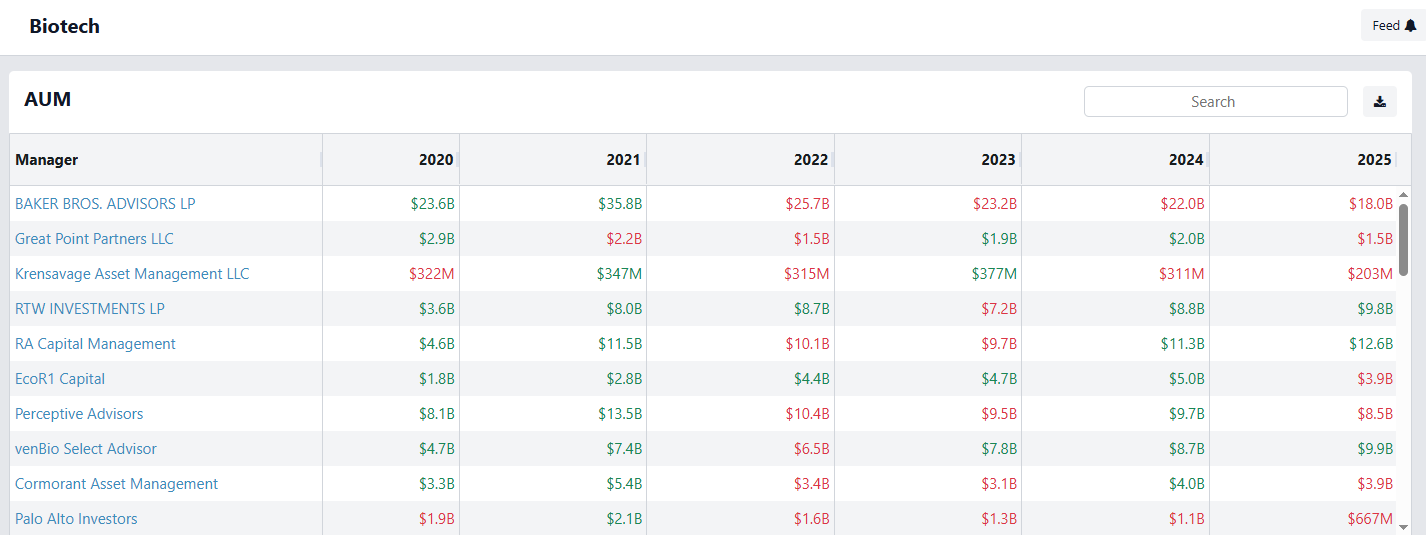
OWL users can now search through our database of over 13,500 managers and filter by whether the firms manage any capital via an SMA, or Separately Managed Account. Users can filter for this metric in OWL’s manager table and it’s also noted at the top of each individual manager profile. More than 4,000 managers in OWL disclose that they have an SMA.
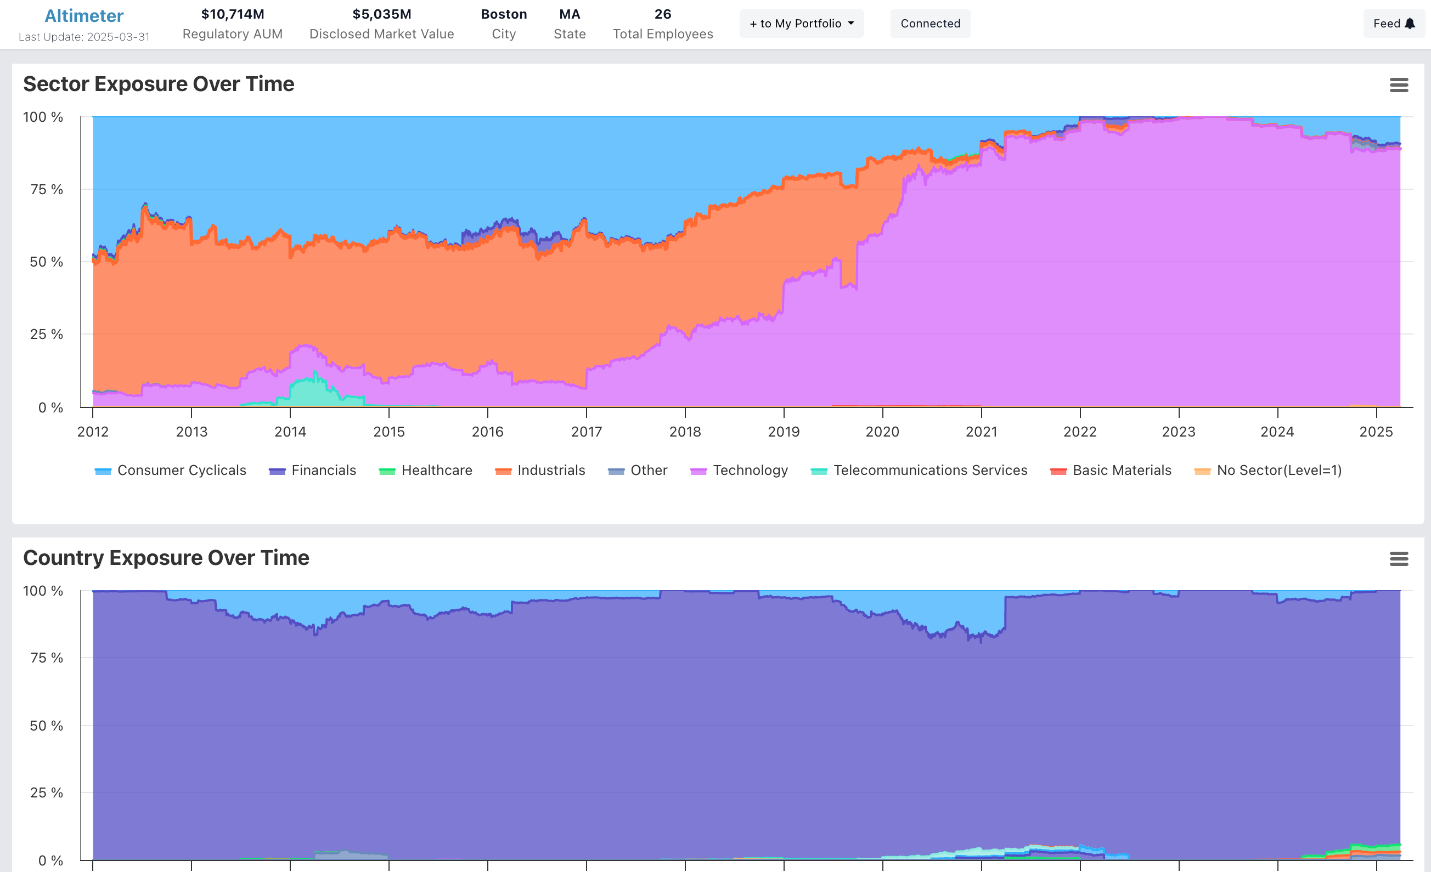
We updated our Exposure page to align with the rest of OWL’s design system and make it easier to see all the data together. Users can now see a manager’s exposure over time by sector, country, market cap, and factor, all on one screen.
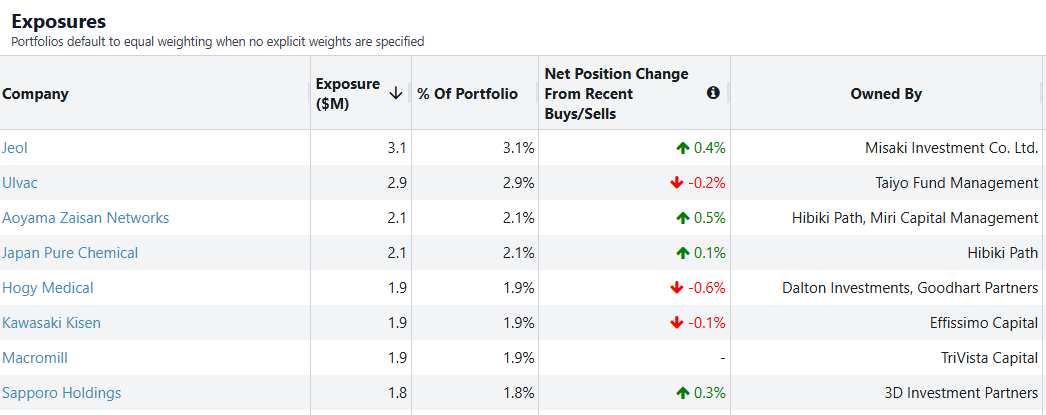
Net Position Change (Buys/Sells)
Within a user’s custom “My Portfolios,” we introduced a new column in the exposures table: Net Position Change from Recent Buys/Sells. This shows the percentage of a portfolio allocated to recent buying or selling activity, helping users distinguish between positions that grew due to price movement and those that reflect recent manager conviction.
One of our customers asked for this analysis recently, and we’re excited to roll it out to all users.
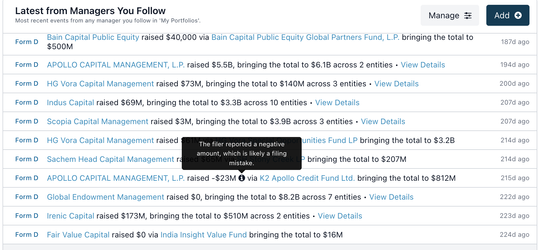
Info on Negative Form D Raises
Occasionally a manager makes a filing error on a Form D that results in a negative value for dollars raised. You’ll now see a flag noting when this is the case, mitigating any confusion the filing error may cause.
We continue to expand the breadth and depth of our data. In March, we added:
Two of the features above were requested by customers, so please continue to send us your ideas and requests!
.jpeg)