Stay ahead with the latest from Old Well Labs
Get product updates and insights delivered straight to your inbox.


April was focused on significantly scaling the data on the platform. During the month, we added 3,386 managers, 270k positions, and nearly 300k people. At the end of the month, we had 7,325 managers in OWL.
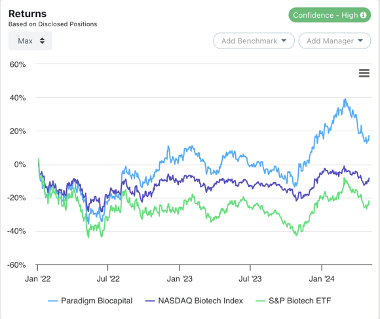
Manager Confidence Scores
Based on user feedback, we added ‘Confidence Scores’ for OWL’s estimated manager returns. Confidence scores guide users on how likely it is that OWL's return estimate is close to the manager's actual return, based on comparing the disclosed market value of open positions against reported AUM values. As a reminder, return estimates in OWL are estimates based on disclosed longs. In many cases they are quite close, but there is a spectrum on which that falls. The confidence score shows up next to the manager return tables in OWL, as seen below, and will soon be a factor that users can filter by when using the various search tools in OWL:
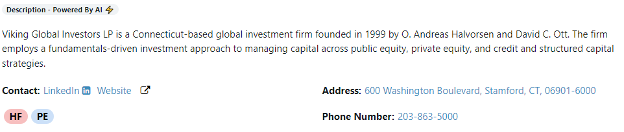
Manager Tags
Each manager’s summary section now includes tags to show the type of manager, including labels like hedge fund, private equity, or venture capital. This is just the first phase of tagging – we plan to further expand and refine these in the future, while also incorporating them into search features so that users can quickly identify and filter by the type of manager.
Top 10 Position Change Indicators
For managers that disclose public equity positions, their top 10 are a key feature of the manager dashboard. To enable users to quickly see where managers are increasing or decreasing positions, we added color-coded indicators to show recent changes. You can also click “View All” to see a manager’s entire publicly disclosed portfolio, including recently exited positions.
Position-level Transaction Details
Digging a little deeper into a manager’s portfolio, for any manager position you can click in to see a full history of buys and sells, including their percentage ownership of the company over time.
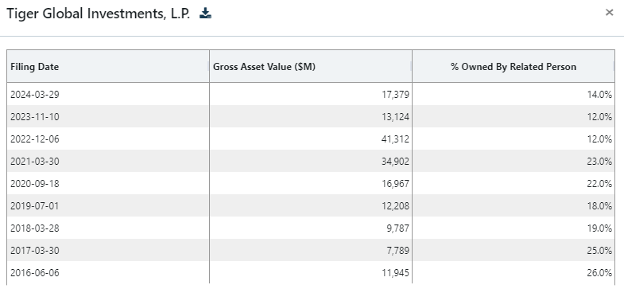
Internal Capital
We’ve also added a few new ways to further explore the different funds each manager has, including internal ownership of each fund over time. In March, we added data showing all of the funds a given manager discloses, enabling users to see when new funds were launched or closed. In April, we added the ability to see how much of each fund is internal capital (typically defined as employees and related parties), and how that has changed over time.
Users can also click on an individual fund and see how that internal ownership percentage has changed over time, eliminating the effect of changes in valuation.
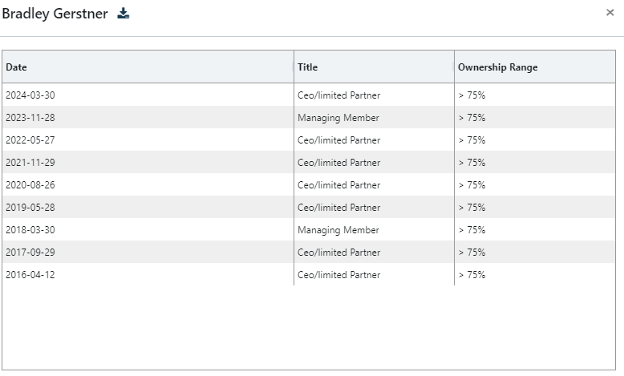
Key Executive and Ownership Levels
Fund managers are also required to disclose key executives on an annual basis, along with their ownership percentage of the overall firm. For any manager in our database, you can see not only the current key executives and their ownership status, but how that has changed over time:
Usability and Accessibility
We have made significant updates to make the location features more mobile-friendly for users that are on the go. While traveling, users can now more easily navigate the mapping features that enable them to find managers in a given location, including filters by manager type and AUM. Additionally, we added download capabilities for all tables across the site, enabling users to use and manipulate the data in ways that work for their daily workflows and processes.
.jpeg)