Product Updates
December 2025
As we head into 2026, we’re excited to reflect on some of the most impactful improvements to OWL over the past year. Below is a high-level summary of key updates from 2025 as we continued to strengthen OWL as the leading platform allocators use to find and monitor fund managers.
We redesigned the landing page to deliver a personalized feed, allowing OWL users to save significant time and resources monitoring the managers they follow. Throughout the year, we expanded the feed data to include disciplinary disclosures, AUM updates, service provider changes, LP base changes, and more. These feeds are also accessible directly from each manager’s profile and when viewing groups of managers in OWL.
In July, we launched detailed manager tags powered by large language models and OWL’s proprietary data. Allocators can now filter managers using 81 tags across asset class, geography, sector, market cap, and sub-strategy, making manager discovery and search on OWL more precise and powerful than ever.
In October, we introduced a customized, AI-powered news feed that allows users to track daily news and content about the managers they care about. OWL ingests content from thousands of sources and uses multiple LLMs to filter, tag, and summarize articles, ensuring allocators see only what is meaningful and relevant for each manager.
We added several new data sources to further enrich manager profiles, giving users more critical information at their fingertips. These include disciplinary data from the SEC and detailed information on manager service providers.
We added more than 3,000 manager profiles in 2025, bringing the total to more than 15,000. We expect this progress to continue in 2026 as we continue to add managers across all asset classes.
We continued to scale our employee dataset, growing to nearly 1.4 million individual profiles – up from approximately 1 million last year.
Building out our allocator database was a major priority in 2025. We grew from roughly 2,000 allocators to almost 7,000, while disclosed allocator holdings (manager investments) expanded more than 10x to 618K. We expect this meaningful growth to continue in 2026.
We hope these enhancements have improved our users’ experience, and we look forward to bringing you more valuable updates in 2026.
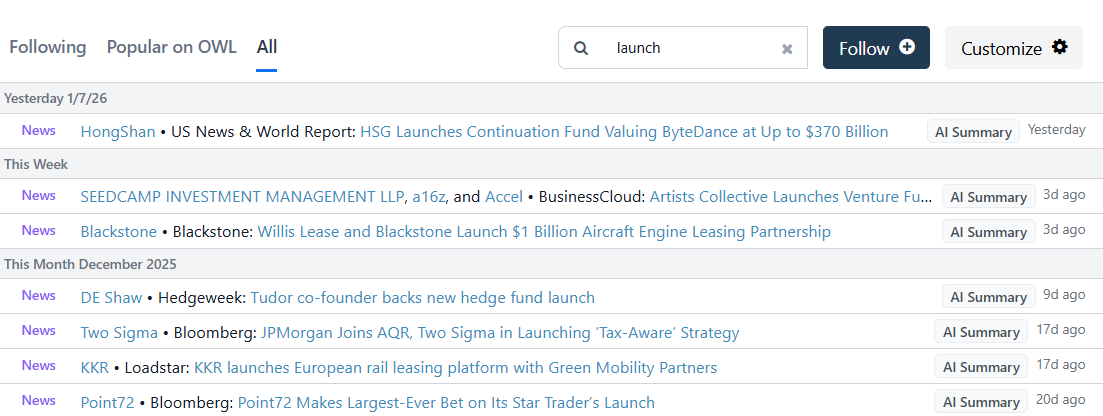
In December, we continued to enhance the customized feed that users see when they log in to OWL. A new search bar allows users to search within their customized feed and within the feed of all OWL events by manager name, keyword, or topic to quickly find relevant alerts. Users can now search for manager names, allocator names, or any topic of interest to find relevant alerts. As an example, searching for the term “launch” brings up a long list of recent fund launches that were covered across multiple media sources.
A new “All” tab lets users explore feeds for managers outside of their existing groups, supporting broader manager discovery and a more comprehensive view of OWL’s data. For example, if OWL updates an LP portfolio, all notable changes in manager investments would show up on this tab, not just changes for the managers a user follows. This tab also provides a comprehensive view of news across the LP/GP ecosystem, so you don’t miss anything important!
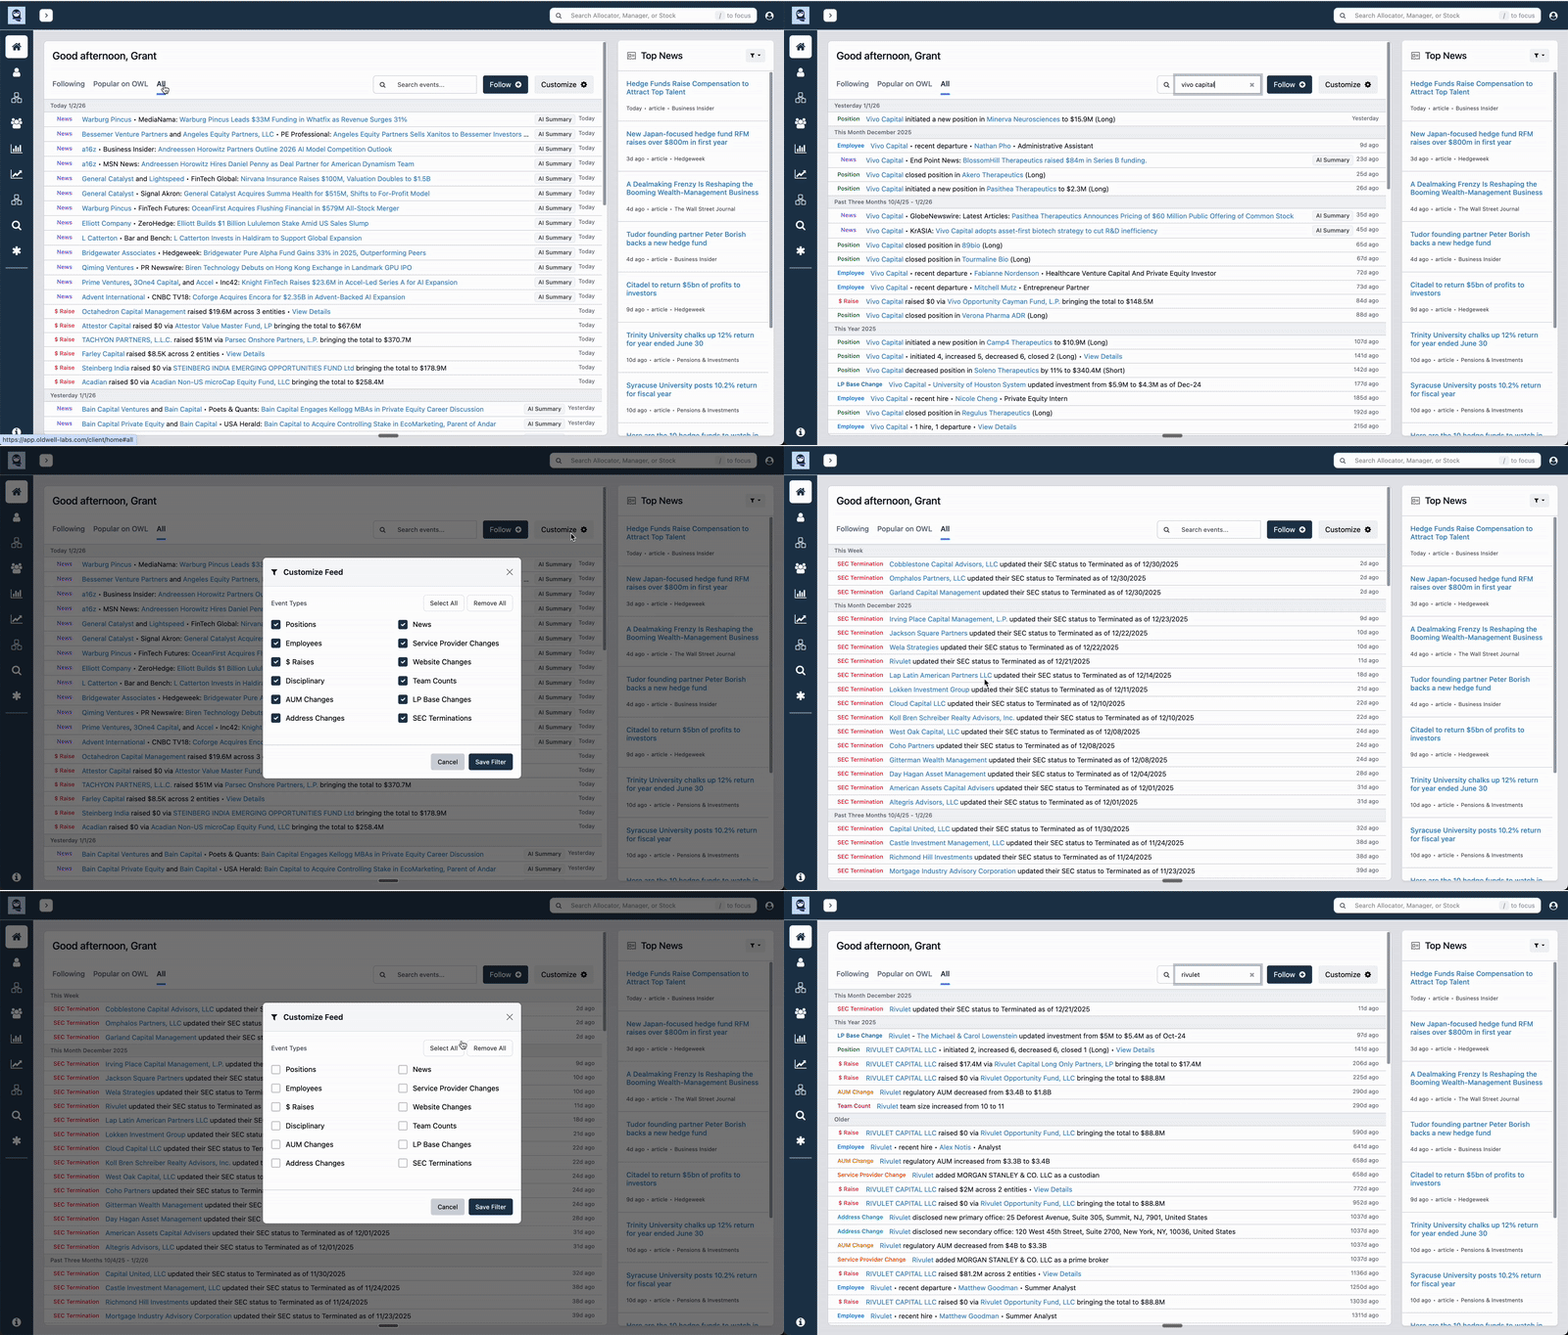
Users can now activate a dedicated feed for SEC Termination alerts – filings submitted when managers transition from an RIA to an ERA or begin winding down operations. These alerts can be enabled via the “Customize” button. One interesting example popped up when Scion (Michael Burry’s fund) updated its status to Terminated in November. In that case, we saw the filing come through before any news outlets had covered it.

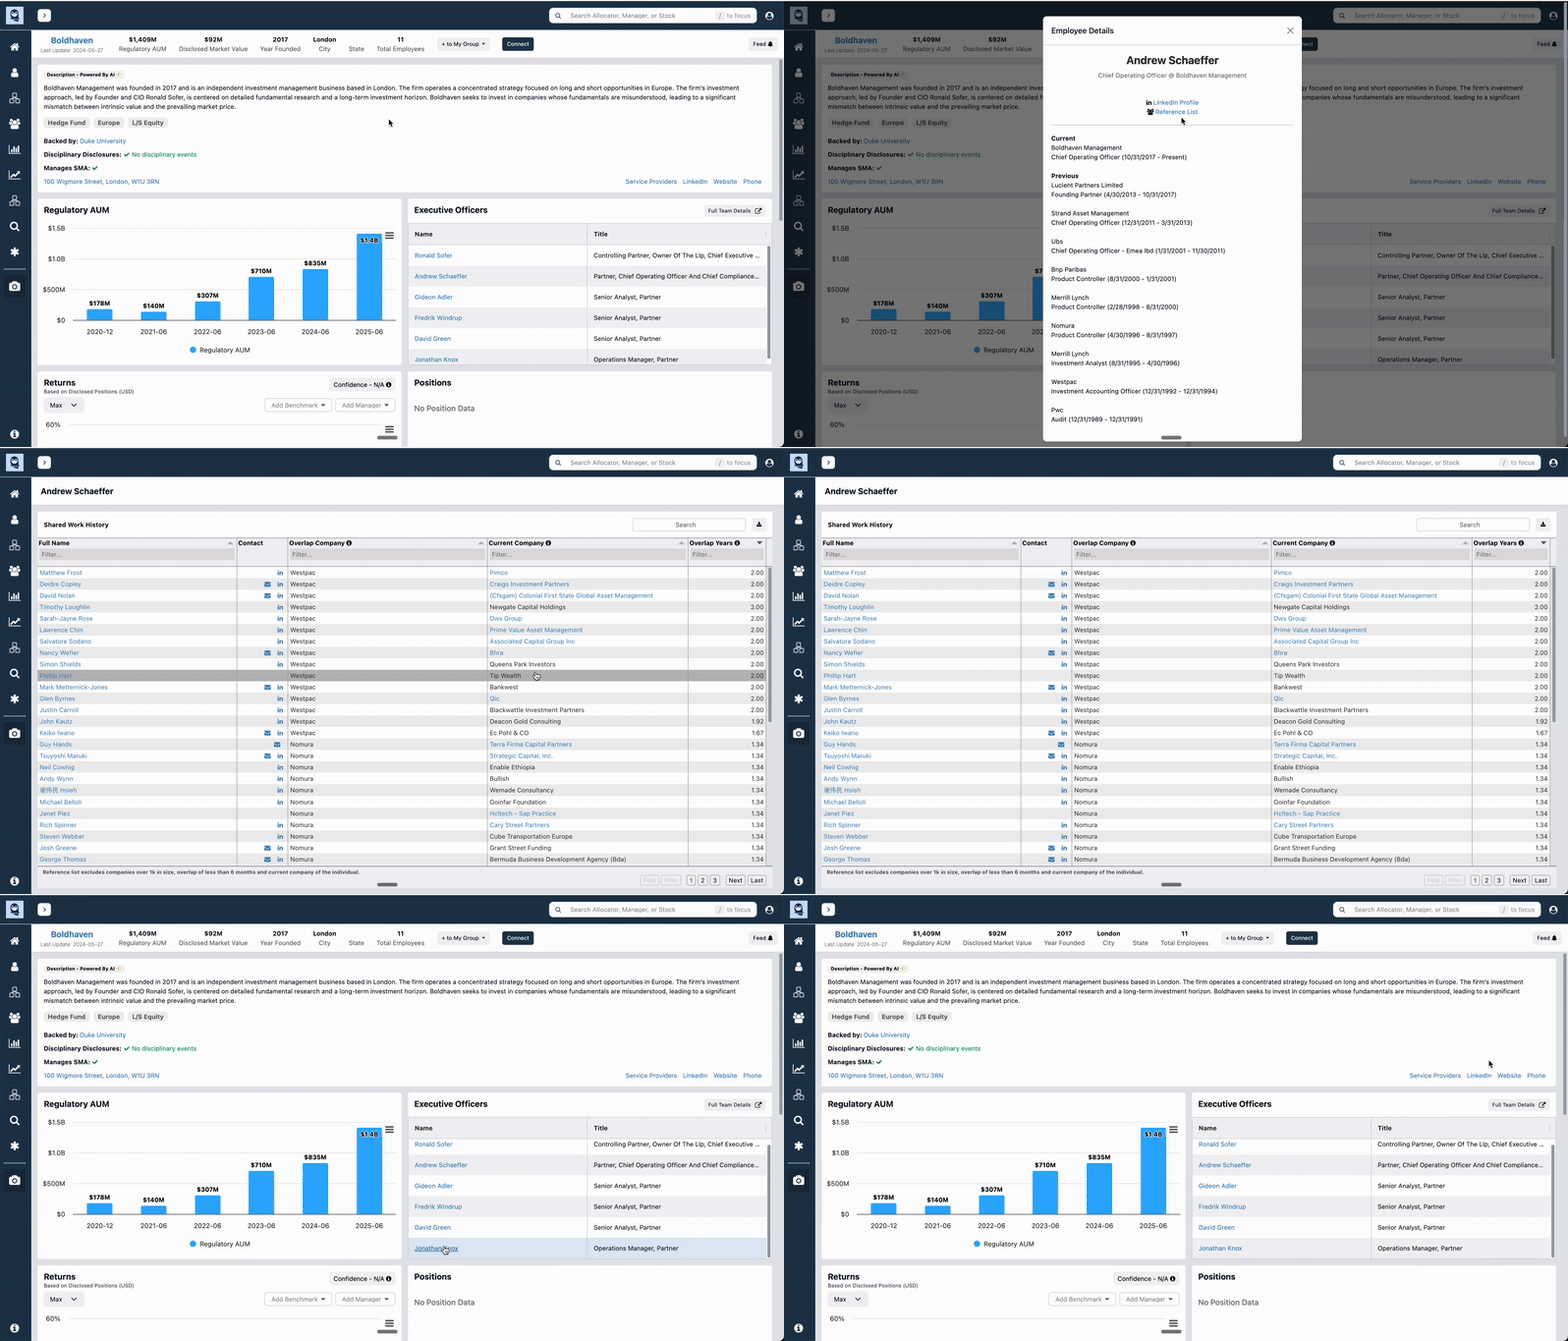
Users can now quickly access key people data directly from manager summary pages. In addition to the detailed information on each manager’s employee pages, now you can also quickly access key people in the Executive Officers section of the summary page. This gives users faster access to a person’s employment history and potential references.
October 2025
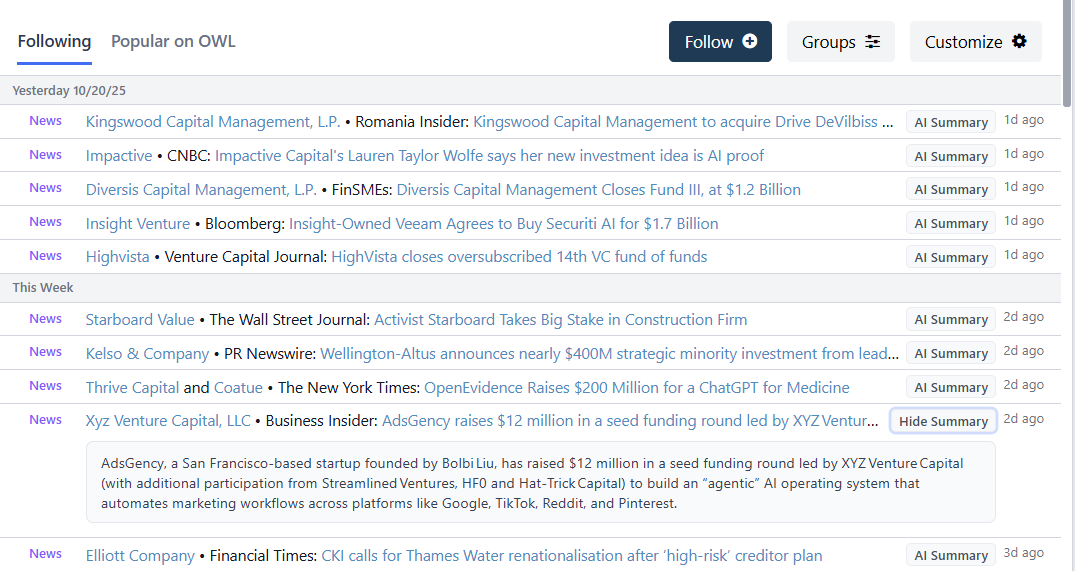
We recently launched one of the biggest updates in OWL’s history – a customized news feed that allows users to track daily news articles and other content about the managers they care about. This is something that we always wanted as allocators. Tracking news about hundreds of fund managers has always been close to impossible - too many click-bait articles, too many alerts to manage one by one.
No more Google News alerts – now OWL does it for you!
OWL now ingests news and other content from hundreds of sources and uses multiple LLMs to filter, tag, and summarize the articles - showing only what’s meaningful and relevant for each manager.
Users will see these updates in their event feeds on the OWL landing page and anywhere they open a feed on a manager or group page. Each article includes an AI summary, and users can click through to the source article.
Users can customize which managers they get news about by “following” any of the 14,000+ managers in OWL, or they can create a custom group of managers using the My Groups feature. Additionally, the Popular on OWL feed allows any user to see news and events for a broad set of well-known managers.
Earlier this year, we added alerts for stock position changes, team changes, fund updates (new funds launched, money raised), and disciplinary events. We recently added several new alerts about managers including LP base changes, service provider changes, address updates, and AUM changes. Users can now see those updates on their feed for any manager they follow. Every user’s feed is fully customizable, enabling them to choose the types of alerts they want to see.


This update massively increases OWL’s value as tool to monitor managers, saving users time and helping them cover more ground without needing to use multiple systems or internal resources.
OWL’s unique data sourcing and AI pipelines let users track critical information about the managers they care about, from news and team changes to global ownership disclosures, LP base changes, disciplinary events, new fund launches, and more:
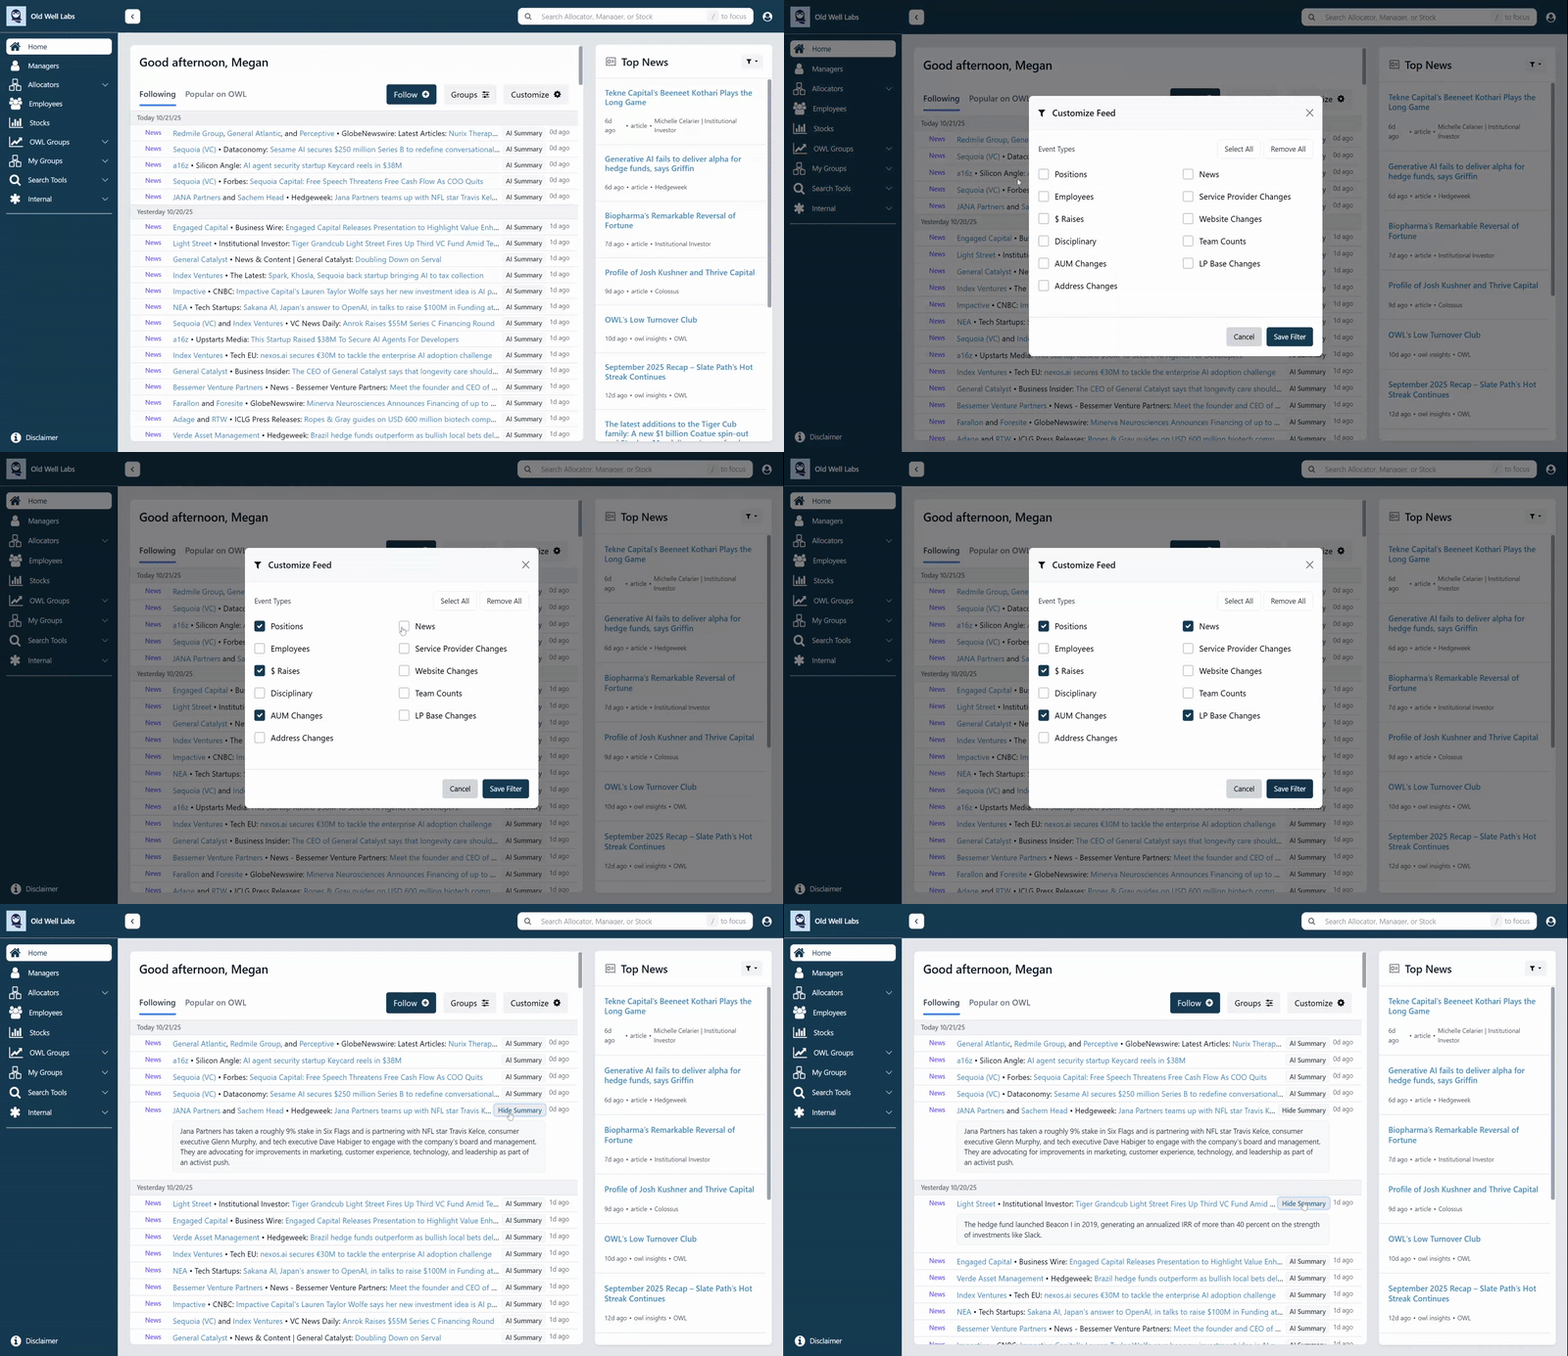
As always, what’s on OWL today is just the starting point. We value your input and feedback – keep the ideas coming!
August 2025
In August, we added alerts for disciplinary events, continued to scale our allocator database, and made it easier for users to request managers or allocators to be added to the system.
Earlier this year, we added disciplinary data to manager profiles, allowing users to see if a firm has disclosed any lawsuits, regulatory fines, criminal charges, or other disciplinary events.
In August, we added the ability for users to know about a manager's disciplinary events as soon as they are disclosed, rather than having to check the manager's profile. When a manager discloses a disciplinary issue, users now get alerts on their dashboard and via email. These alerts are an important addition to our dashboard and alert system, which already includes team movements, changes in global stock positions, and capital raised.
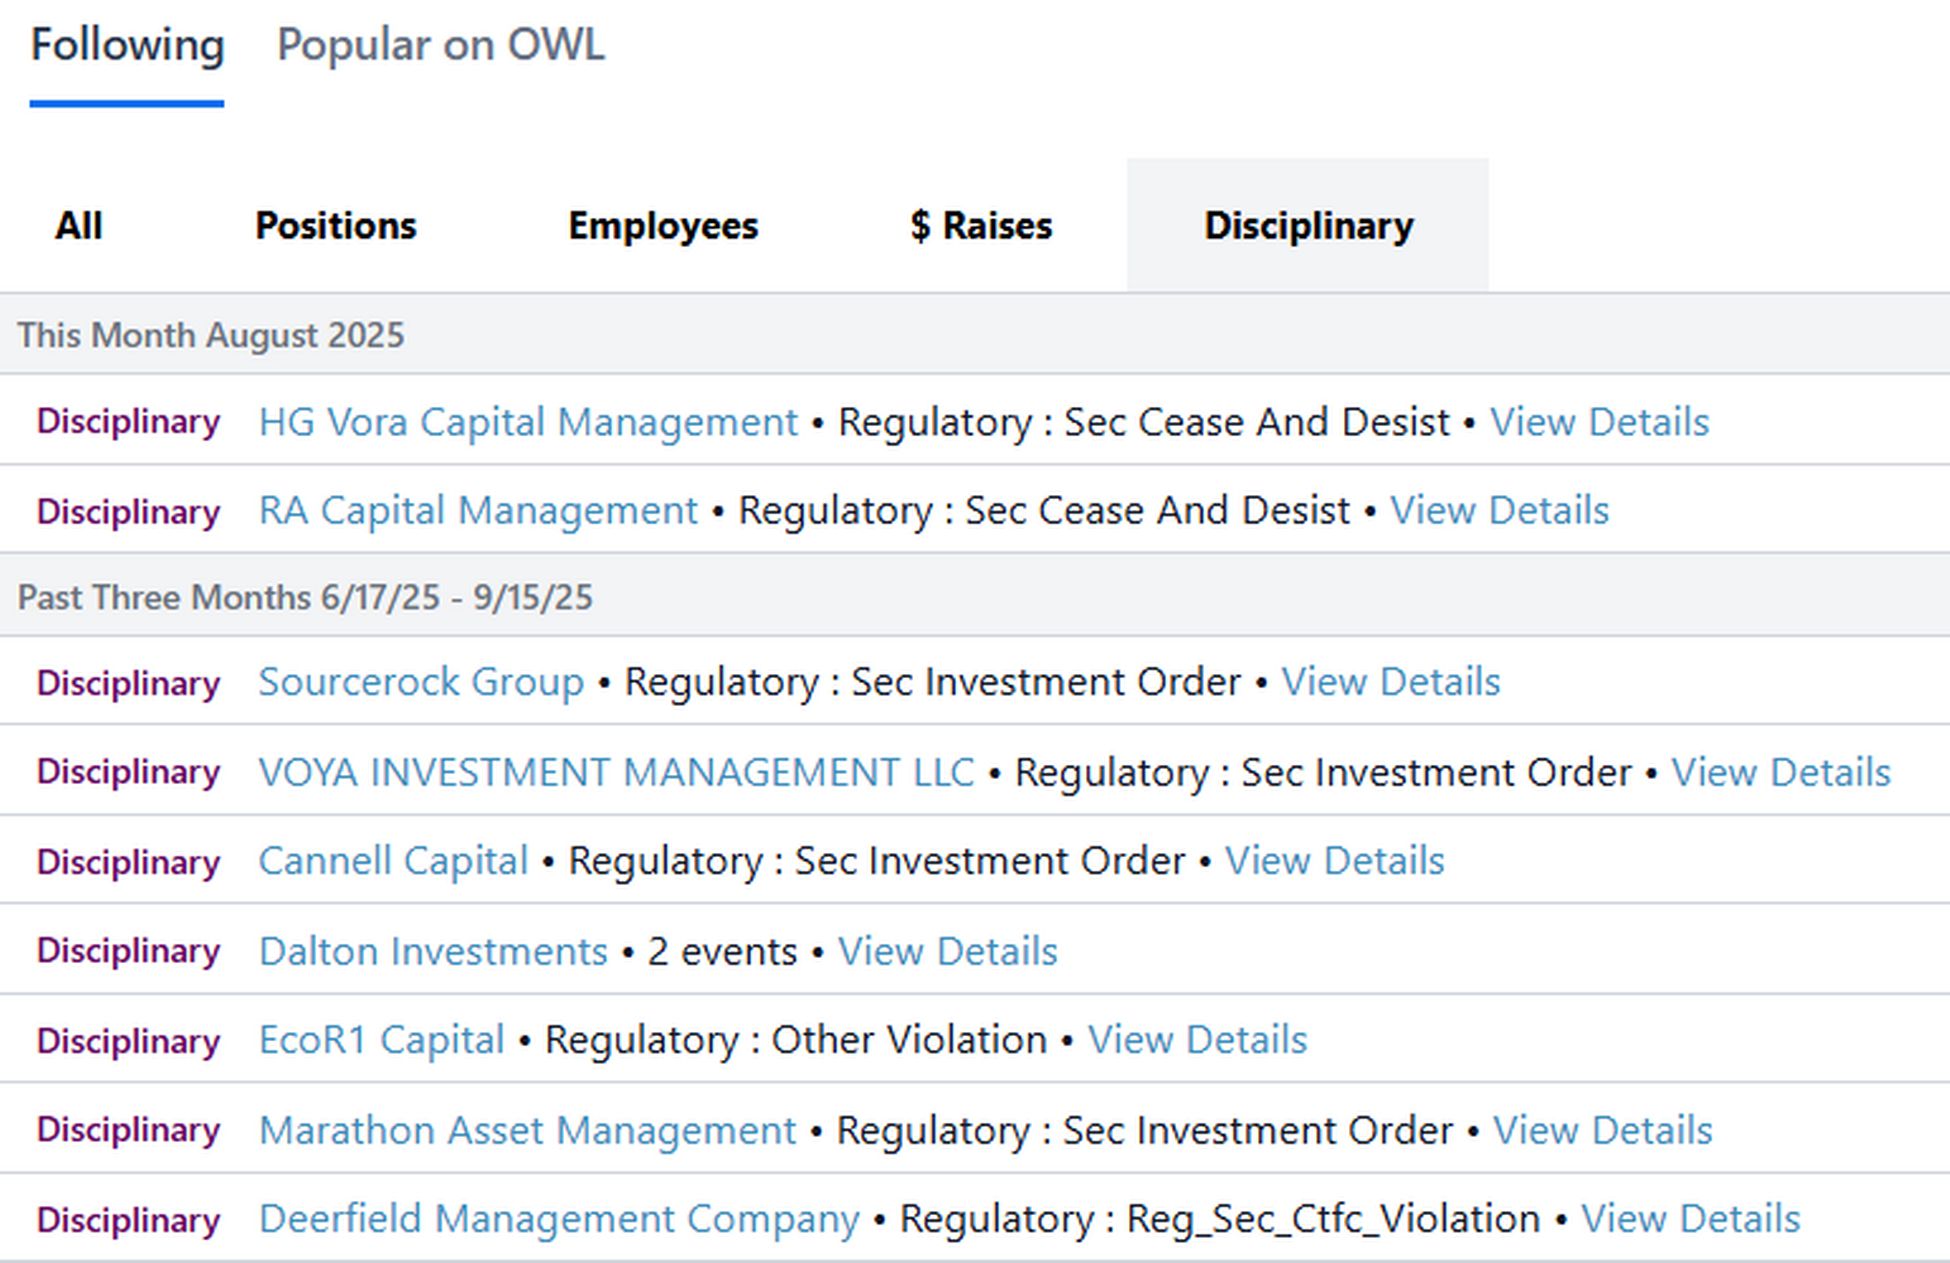
In August, we also built out the infrastructure for additional alerts for important events, which will soon include new LP allocations to managers, vendor changes (e.g., a manager switching auditors), AUM changes, and several others.
One of OWL’s most unique and popular data sets is our allocator holdings data. We now have more than 3,000 profiles of leading allocators in OWL, including details of the manager investments disclosed by these allocators. There are hundreds of obscure and hard to find sources where OWL collects this data. We’ve spent years building the highest quality dataset for large endowments and foundations, allowing our users to track their peers, as well as source and monitor managers.
In August, we added more than 1,600 new allocators, mostly focused on foundations and family offices. Many of the new foundations have publicly disclosed portfolios, increasing the number of LPs we’re able to identify for any given manager. As an example, a few months ago, OWL disclosed ~100 allocator positions in Tiger Global, and that number has now increased to 182. We plan to add thousands of additional allocator profiles of all types in the coming months.
While OWL includes profiles of more than 14,000 managers and 3,000 allocators, users occasionally look for a manager or allocator that we haven’t added yet. Now users can request that the manager or allocator be added with just one click, and our team can typically add it within a few hours:

- In our Report Builder function, we increased the number of managers that a user can analyze from 5 to 30 at any given time, allowing users to build more comprehensive reports.
- On our manager search table, we updated the default search criteria and re-ordered the dropdowns to provide a more intuitive search process. As a reminder, we launched AI-powered manager tags in July, allowing users to filter managers by nearly 100 tags spanning asset class, geography, sector, market cap, and sub-strategy.
July 2025
We shipped several powerful new features in July, including AI-powered manager tags, service provider data, and additional allocator profiles. As always, we added lots of additional data to OWL, including 341 new managers and more than 180,000 new people profiles.
We launched detailed manager tags in July, powered by large language models and OWL’s unique data. Users can now filter managers by 81 tags spanning asset class, geography, sector, market cap, and sub-strategy - making manager search on OWL more precise and more powerful than ever. Some examples of what you can now search for:
- Small/mid-market buyout managers in Europe with over $200 million AUM
- U.S.-based long/short equity managers with low turnover, concentrated portfolios, and high alpha on long positions
- Early-stage VCs in San Francisco with no disciplinary disclosures filed with the SEC
- Global small- and mid-cap public equity managers with high estimated returns and AUM under $2 billion that offer Separately Managed Accounts
- Crypto-focused managers across asset classes and geographies
- Infrastructure managers, filterable by specific cities and countries
- And much more!
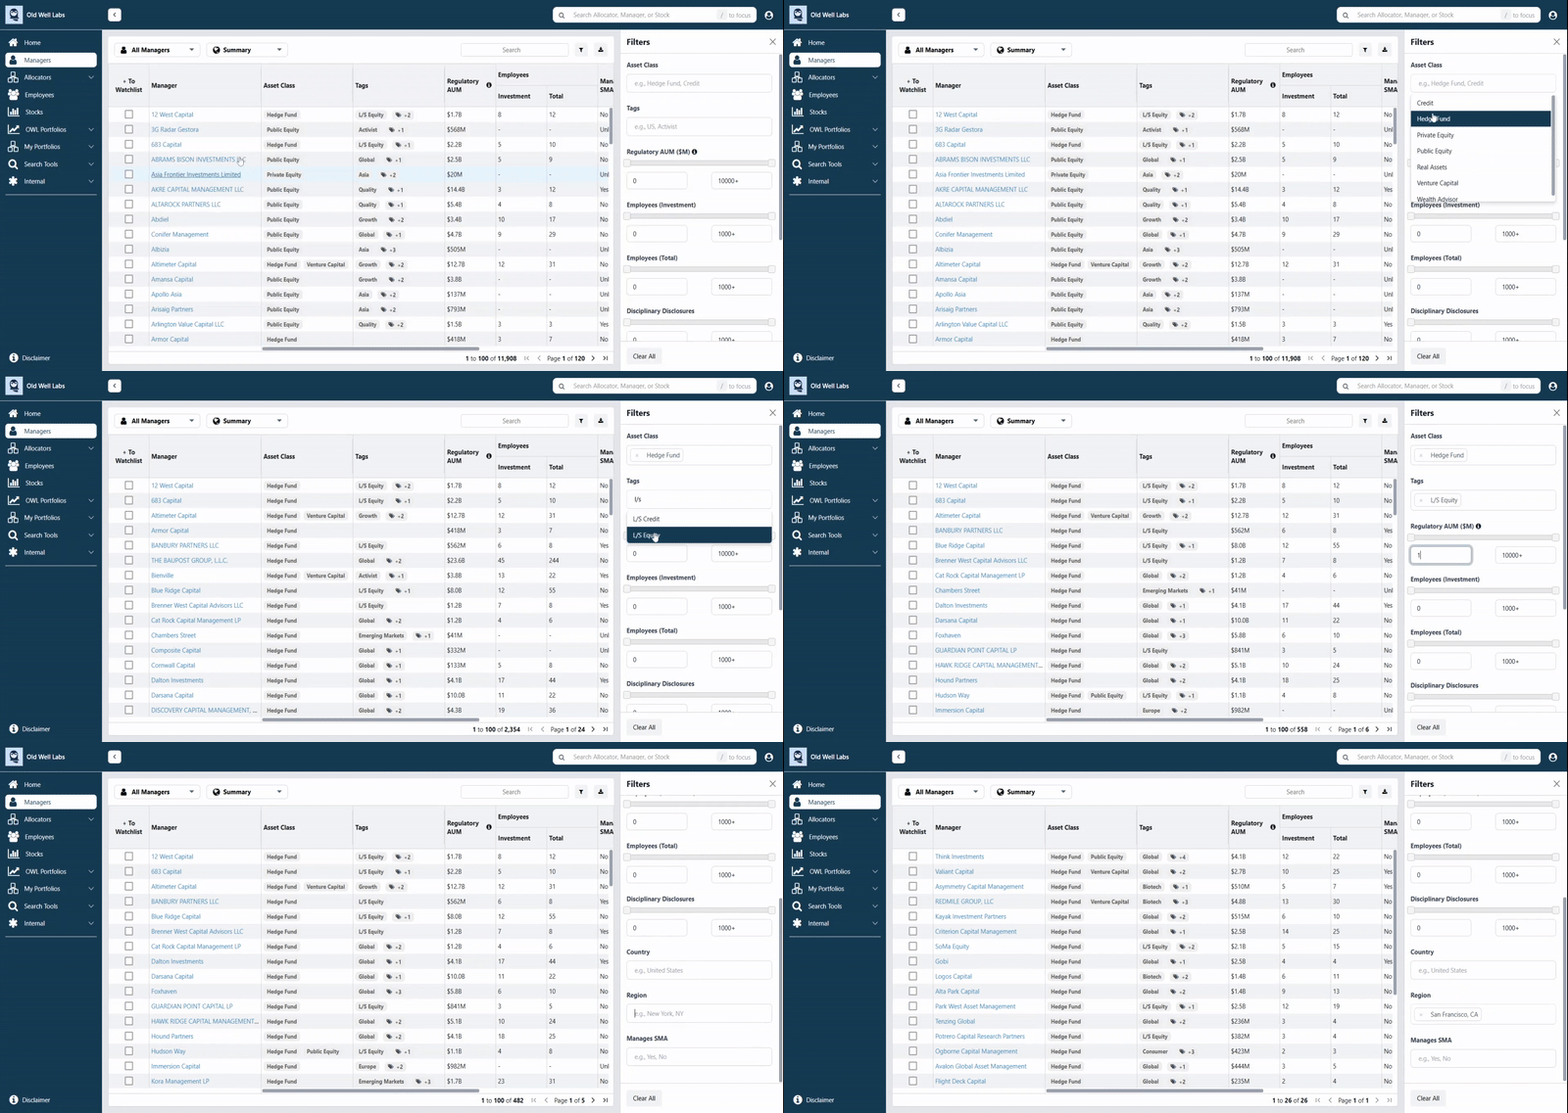
Tags appear on every manager profile and are fully integrated into OWL’s map search for location-specific targeting.
This launch is one of several AI-powered projects in the works at OWL. We combined the capabilities of large language models with OWL’s proprietary data to generate and apply over 35,000 tags in an automated, scalable way.
As always, what’s on OWL today is just the starting point. These tags will improve over time as our data, models, and feedback loops improve.
We also launched service provider data for every manager in OWL. This includes both current and historical relationships with administrators, custodians, auditors, prime brokers, and third-party marketers, representing more than 173,000 service provider records.
Users can find this new information by clicking “Service Providers” on the main manager card or via the dedicated view in the left-hand menu.
This unlocks two key capabilities for allocators:
- Track changes in service providers over time. For operational and investment due diligence, users can now see whether a manager has changed auditors, custodians, or other key partners. Soon, changes like these will also be included in OWL’s email alerts.
- View service provider exposure across a portfolio. In My Portfolios under the “Managers” view, there’s now an option to view all service providers used by any custom group of managers. If this feature had existed in early 2023, users could have identified exposure to Silicon Valley Bank across their manager portfolios with a single click.
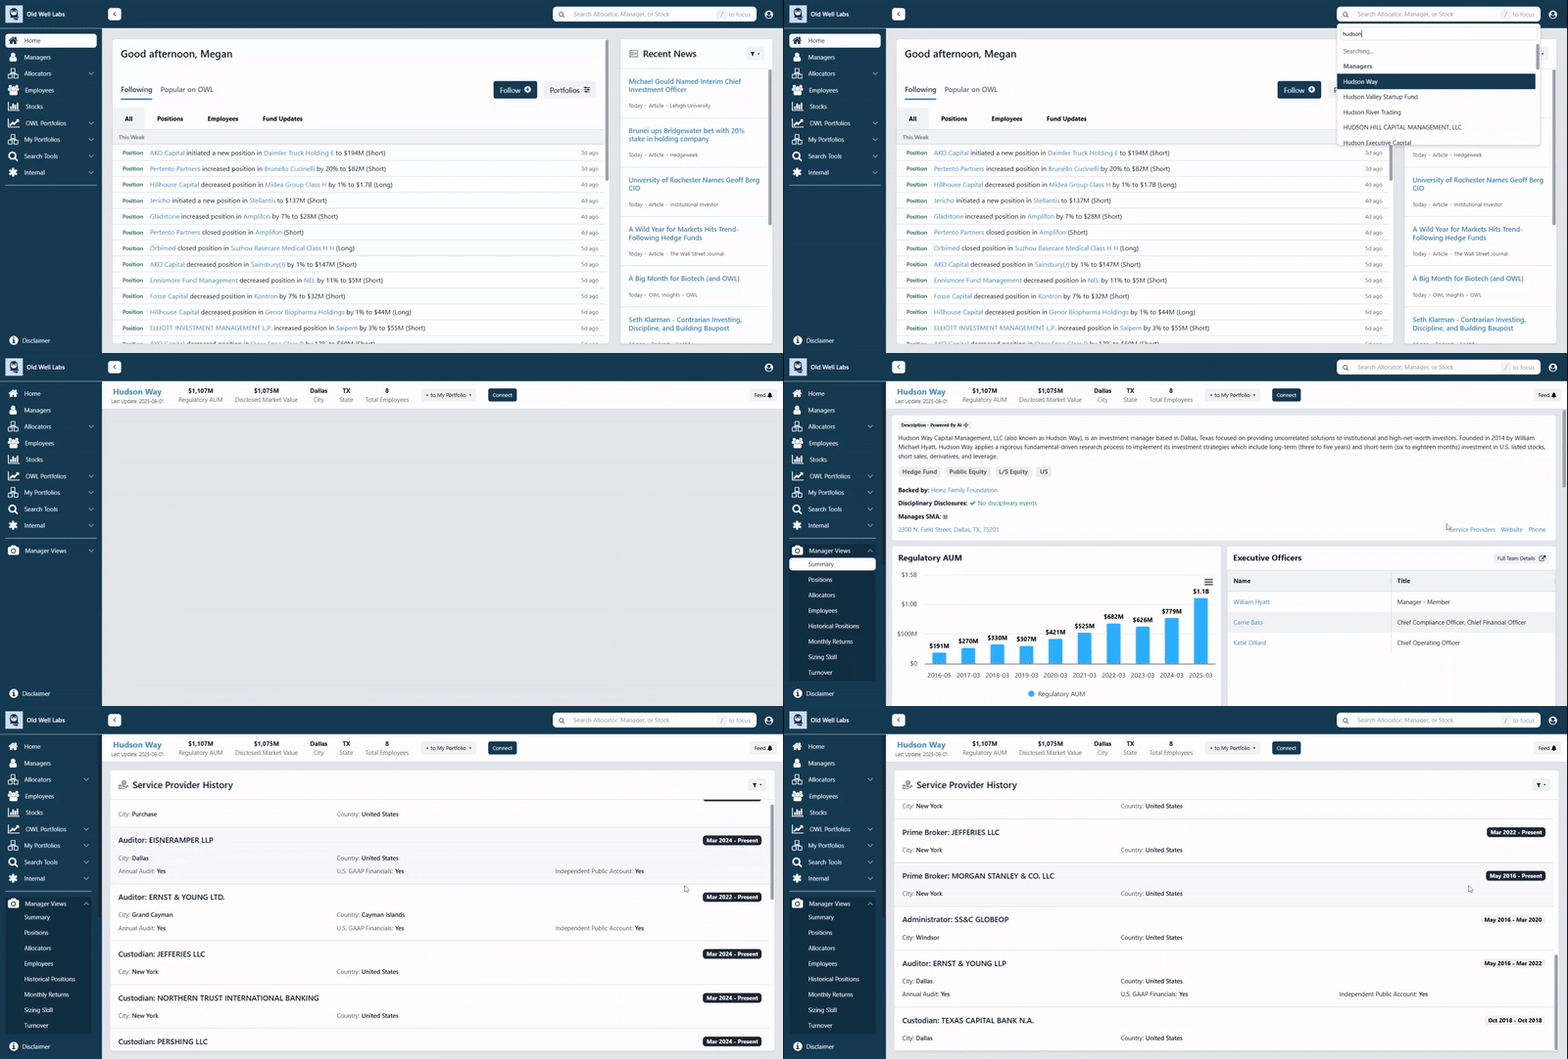
Users can also filter our manager universe by service provider, offering a new way for industry professionals to see a firm’s client base and monitor shifts in the competitive landscape.
One of OWL’s most unique and popular data sets is our allocator holdings data. We currently have ~2,000 profiles of leading allocators in OWL, including any manager investments these allocators disclose. There are hundreds of different sources where this data is available, and it is often hard to find, unstructured, and messy. We’ve spent years building the highest quality dataset for large endowments and foundations, allowing our users to track their peers, as well as source and monitor managers.
In July, we completed a major behind-the-scenes data automation project that will allow us to scale this dataset massively, with thousands of additional allocator profiles coming in the next few months. In addition to more data, OWL will include search and monitoring capabilities for allocators, including custom portfolio monitoring, advanced search, email alerts, map search, and more.
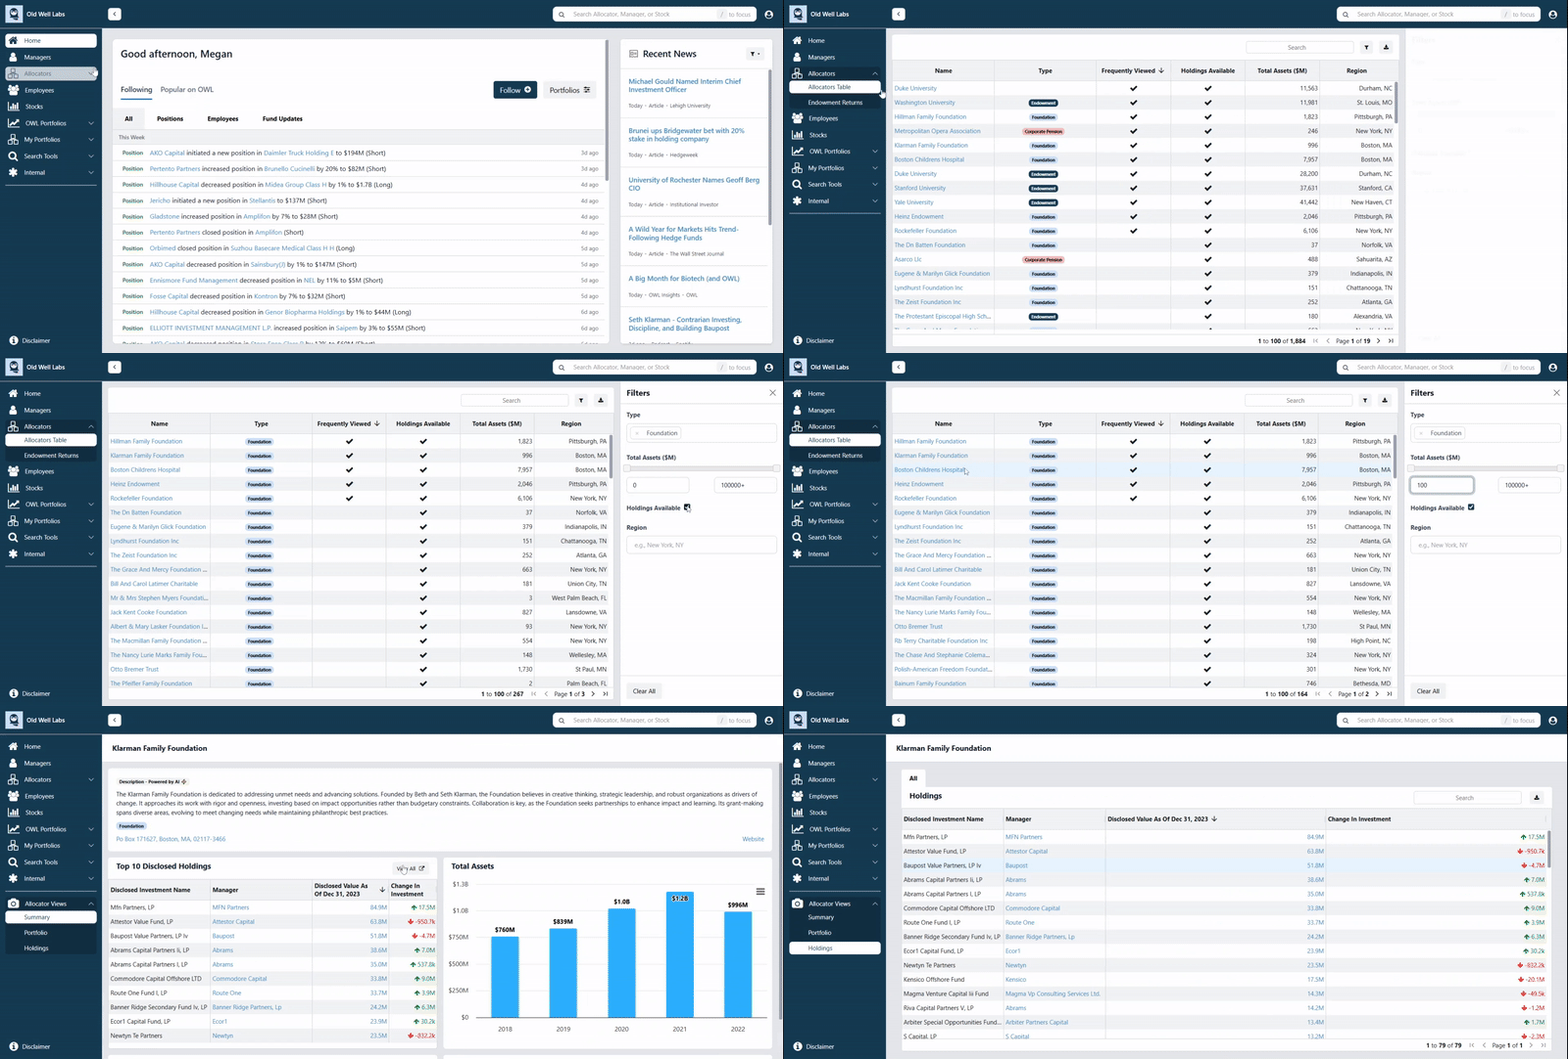
Recent major additions to our data include:
- 341 new managers, bringing the total to 14,239 (up from ~10,000 in June 2024)
- 100,000+ new people profiles, bringing our total to nearly 1.3 million
New managers came from recent ADV filings as well as entities identified through employee moves and allocator holdings.
May 2025
In May, we added manager disciplinary data, opened up portfolio sharing for teams, added the ability to connect with multiple managers at once, and made it easier to add managers to a watchlist.
We launched a new feature highlighting disciplinary disclosures filed by managers with the SEC. On each manager’s profile page in OWL, you can now see whether the firm has disclosed any lawsuits, regulatory fines, criminal charges, or other disciplinary events. For example, you can see below that Hudson Way has not disclosed any disciplinary events.

If there is a disciplinary disclosure, which 1,389 managers in OWL have, users can click on the red “View Details” button and get a list of the disclosures with full details of each. In the example below, OWL users can see that Two Sigma has two disclosures, including a $45 million fine from the SEC earlier this year.

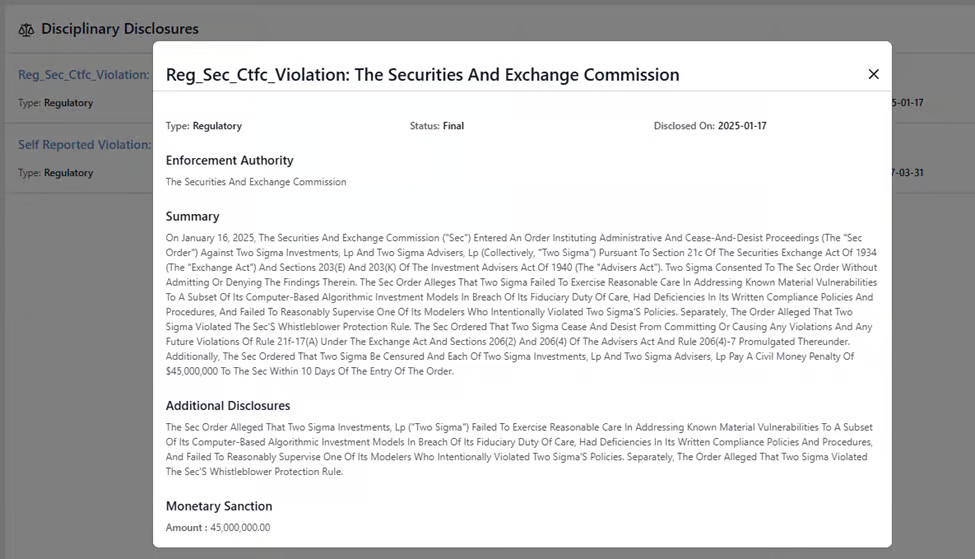
This data is also available as a filter in our manager search table, and soon updates will be included in our customized email alerts, so users can find out immediately if the managers they follow have a new disciplinary disclosure.
We are also excited to announce the ability to share portfolios across an organization. Within the “Manage Portfolios” function, users can toggle the “Share” column from “Individual” to “Team,” enabling read-only access to your portfolios across your organization. As portfolios are shared with you by other team members, you can easily view the managers in the groups using the “+” button or click “Clone” to use the shared portfolio as a starting point for your own, customizable group. This new functionality was a result of direct feedback from our users – keep the ideas coming!
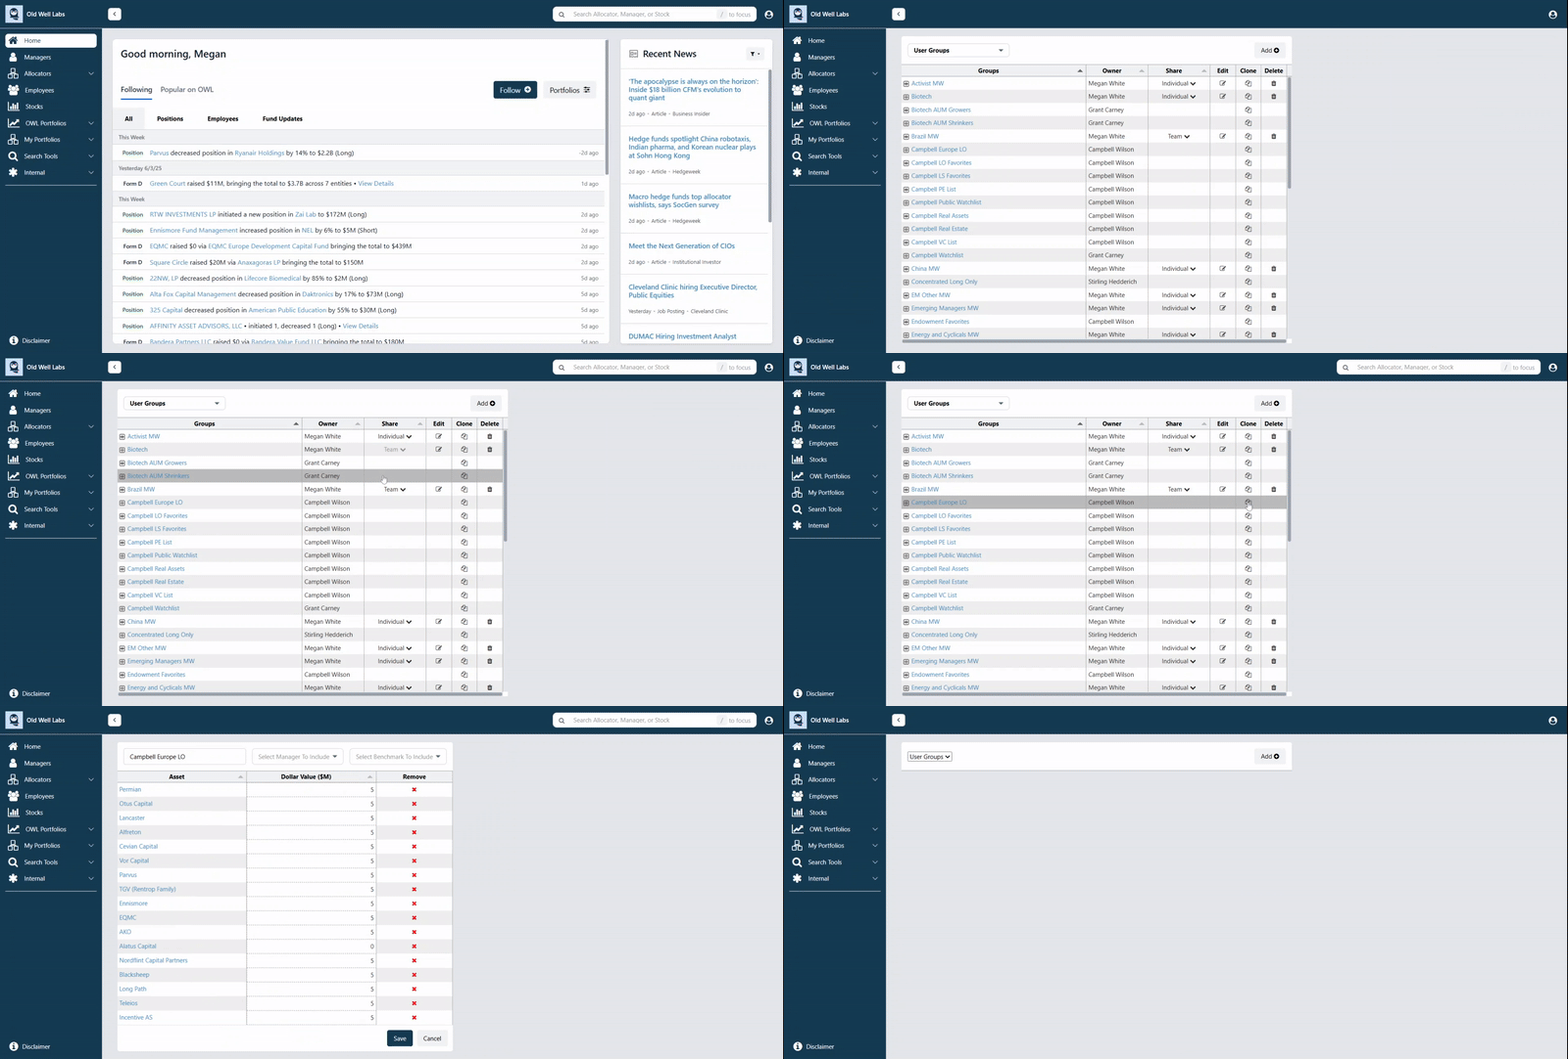
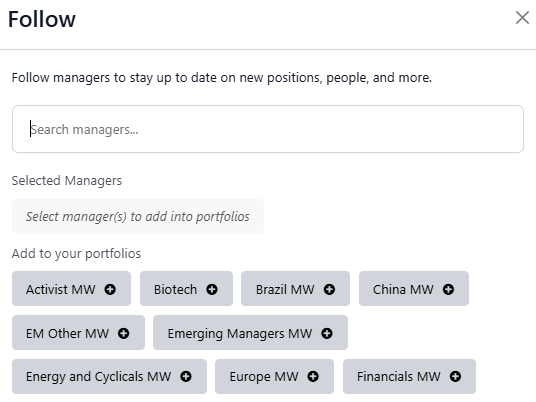
A user’s “My Portfolios” are a central part of the OWL experience. They allow users to monitor different groups of managers, and drive the content that users see on their newsfeed and in their email alerts. To help users build portfolios more quickly, we improved our landing page to make it easier to add managers to your portfolios. While scrolling recent OWL Manager events, you can click “Follow” at the top of the page to quickly add a manager to one of your portfolios or create a new one.
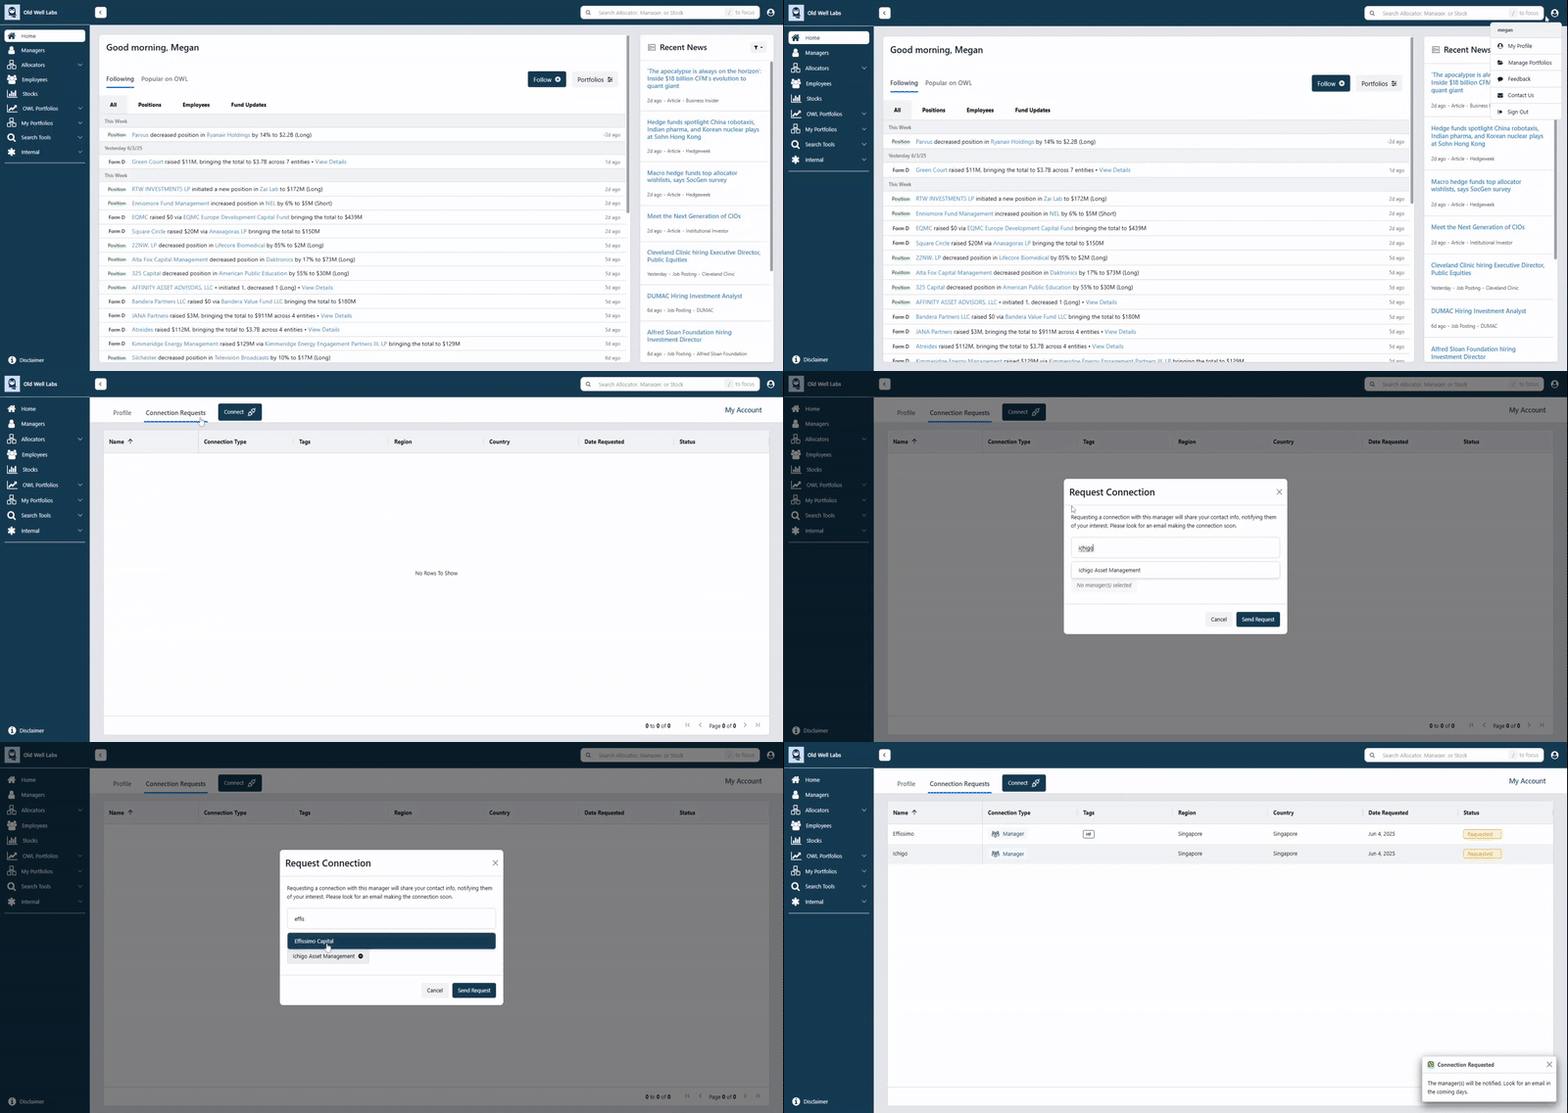
We want OWL to be the easiest place for allocators and managers to connect. This past February, we rolled out the ability for allocators to request connections with managers directly on the platform. In May, we gave users the ability to connect with multiple managers at once. In the “Manage Connections” section of “My Profile,” simply click “Connect” and you can request multiple connections:
Please continue to send us your ideas and feature requests! User feedback is the primary driver of our product roadmap, and we truly value our customers’ opinions.
April 2025
In April, we gave OWL a design refresh, continued to add features to the My Portfolio pages, and refreshed ADV data based on 3/31 manager filings. We also worked on the building blocks for a number of new features that we expect to release in May and June – stay tuned!
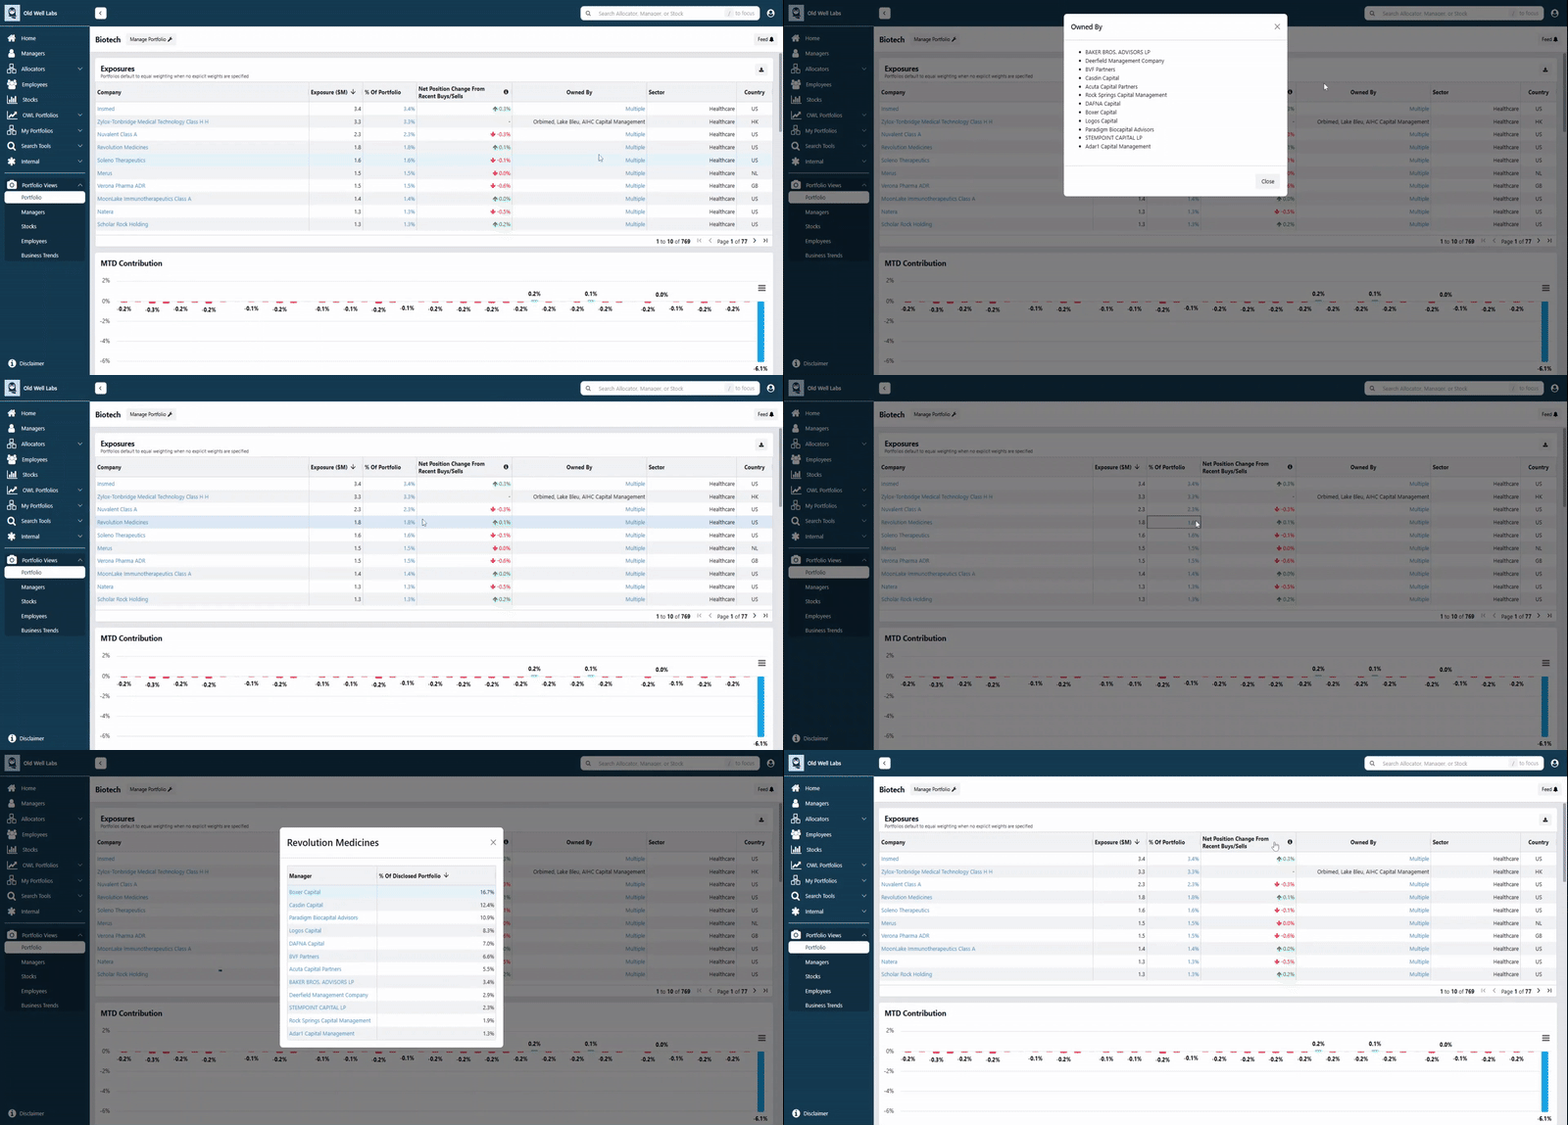
As a reminder, OWL users can set up an unlimited number of “My Portfolios” to track groups of managers and their underlying positions. On the My Portfolios pages, we added a more detailed view of the holders of a particular stock, making it easier to see which managers are driving the exposure in a given portfolio. On the Exposures table, users can now see a full list of managers that own a given stock in the “owned by” column and can also click into the “% of Portfolio” to see each manager’s position size.
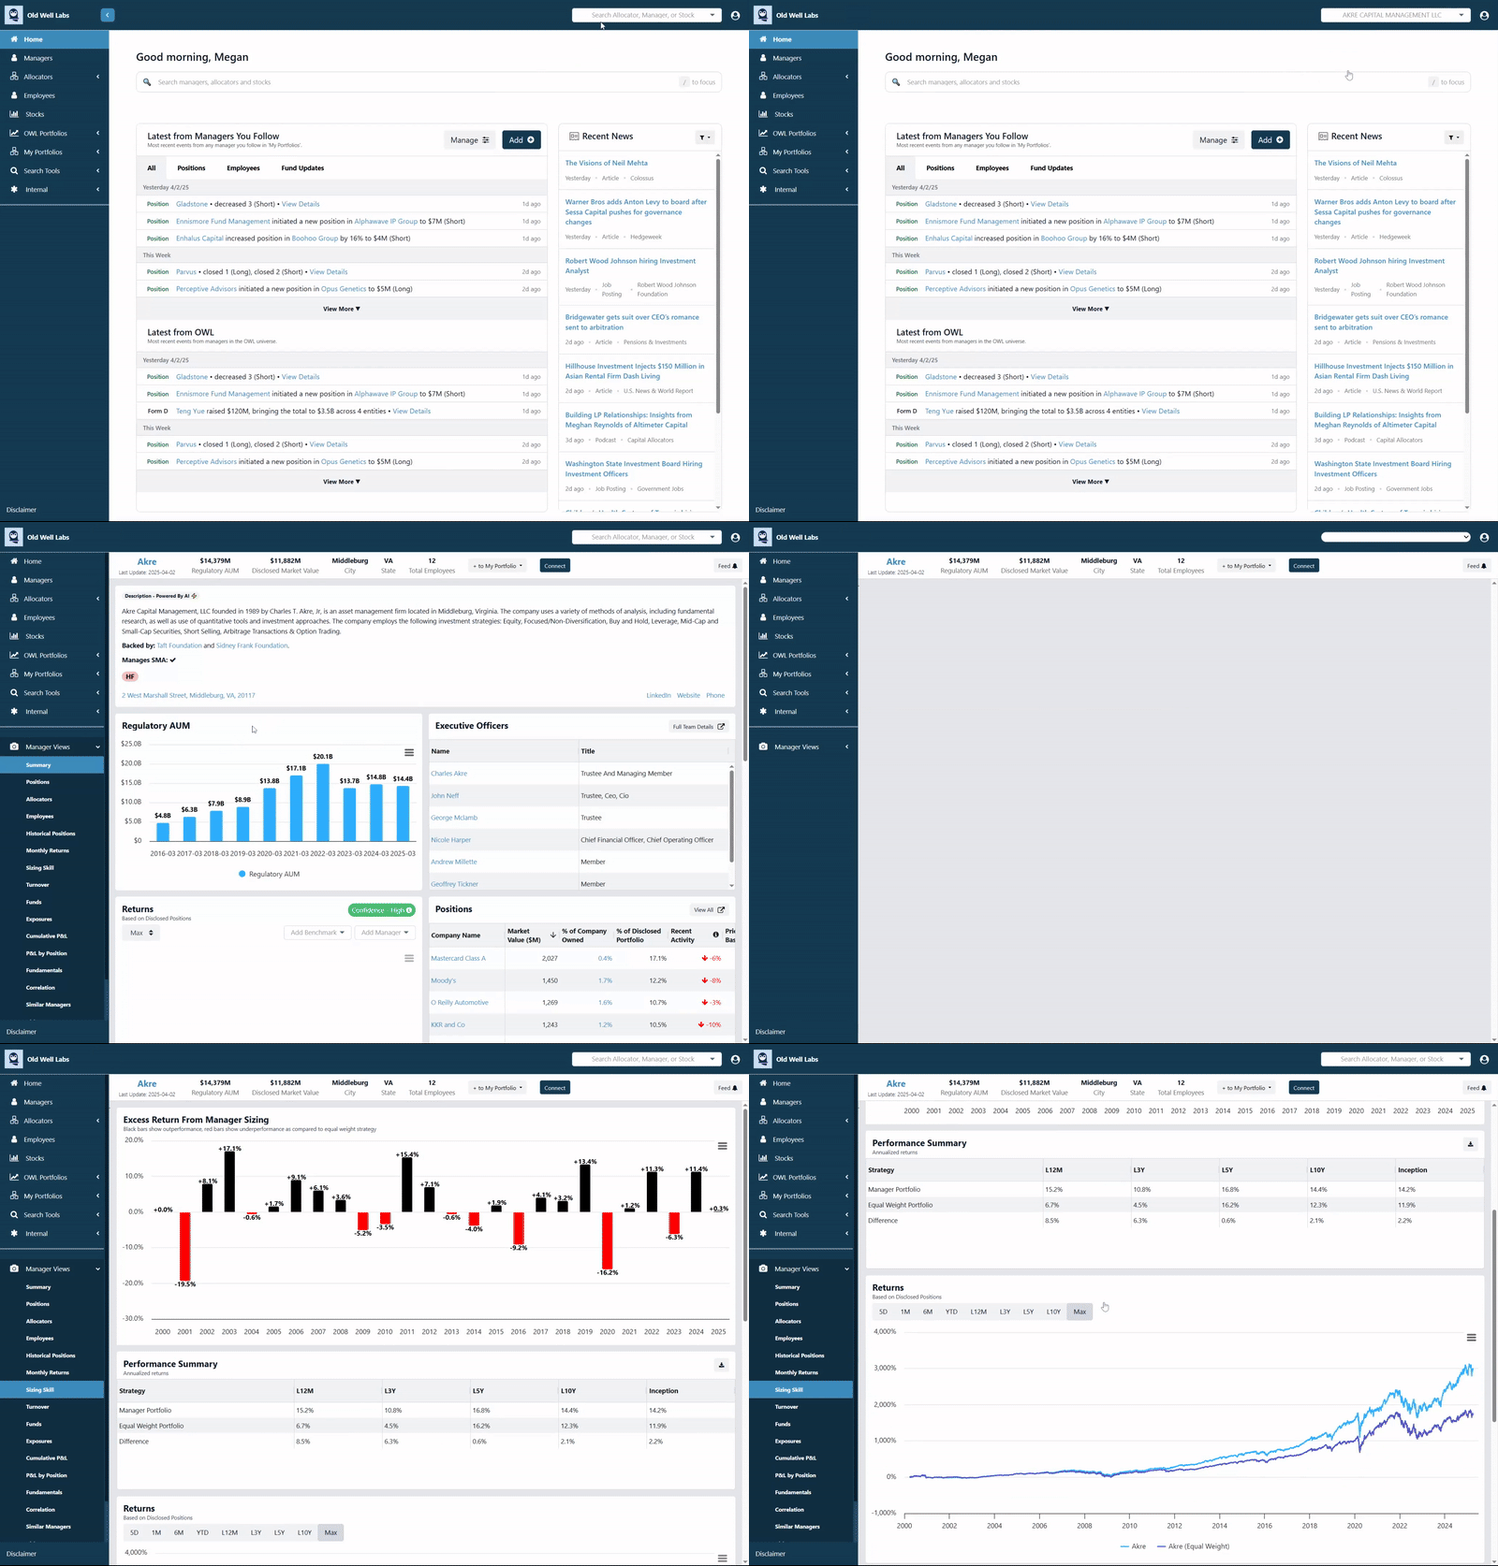
In January, we launched a new home page with a personalized feed designed to surface key updates for the managers our users follow. In April, we refreshed this home page with several new features to make it more user-friendly. For example, users can now use the “/” key to quickly access search, and have more control over the feeds and user navigation displays.
In April, we implemented a more modern user interface, bringing key improvements to performance, compatibility, and overall user experience. While individual changes may be small, the changes made charts and graphics more consistent across the site. Our refreshed design also enhanced site accessibility with improved color contrast and navigation.
We continue to expand the breadth and depth of our data. At OWL, we take pride in having the most accurate and comprehensive data on global position disclosures. As an example, in April, we automated position data in Sweden, mapping hundreds of managers with positions in that market.
We also processed more than 7,000 ADV filings in April, as most managers file them by 3/31 and the data is released shortly thereafter. This ADV data provides up-to-date information on a manager’s business, including AUM, headcount, new fund launches, and internal ownership of its funds.
We currently have almost 14,000 managers and over 1.2 million people records in OWL, and those numbers continue to increase every month. User feedback is critical and plays an important role in our product roadmap – if you have any ideas of what you’d like to see, please reach out!
March 2025
In March, we continued improving OWL’s analytics, usability, and data quality, with a focus on helping allocators better evaluate managers and monitor activity across portfolios.
We launched a new feature that shows how managers’ performance (based on OWL estimates) compares to the performance of an equal-weighted portfolio of the same positions. This analysis helps assess whether managers are adding value through position sizing decisions. This view is available on the “Sizing Skill” view of each manager profile and includes:
- Excess Return from Manager Sizing: Chart with annual outperformance or underperformance relative to an equal-weighted portfolio
- Performance Summary Table: Annualized returns across multiple periods (L12M, L3Y, L5Y, L10Y, Since Inception) comparing manager returns with an equal weighted portfolio
- Cumulative Returns: Cumulative returns of each portfolio over different time periods.
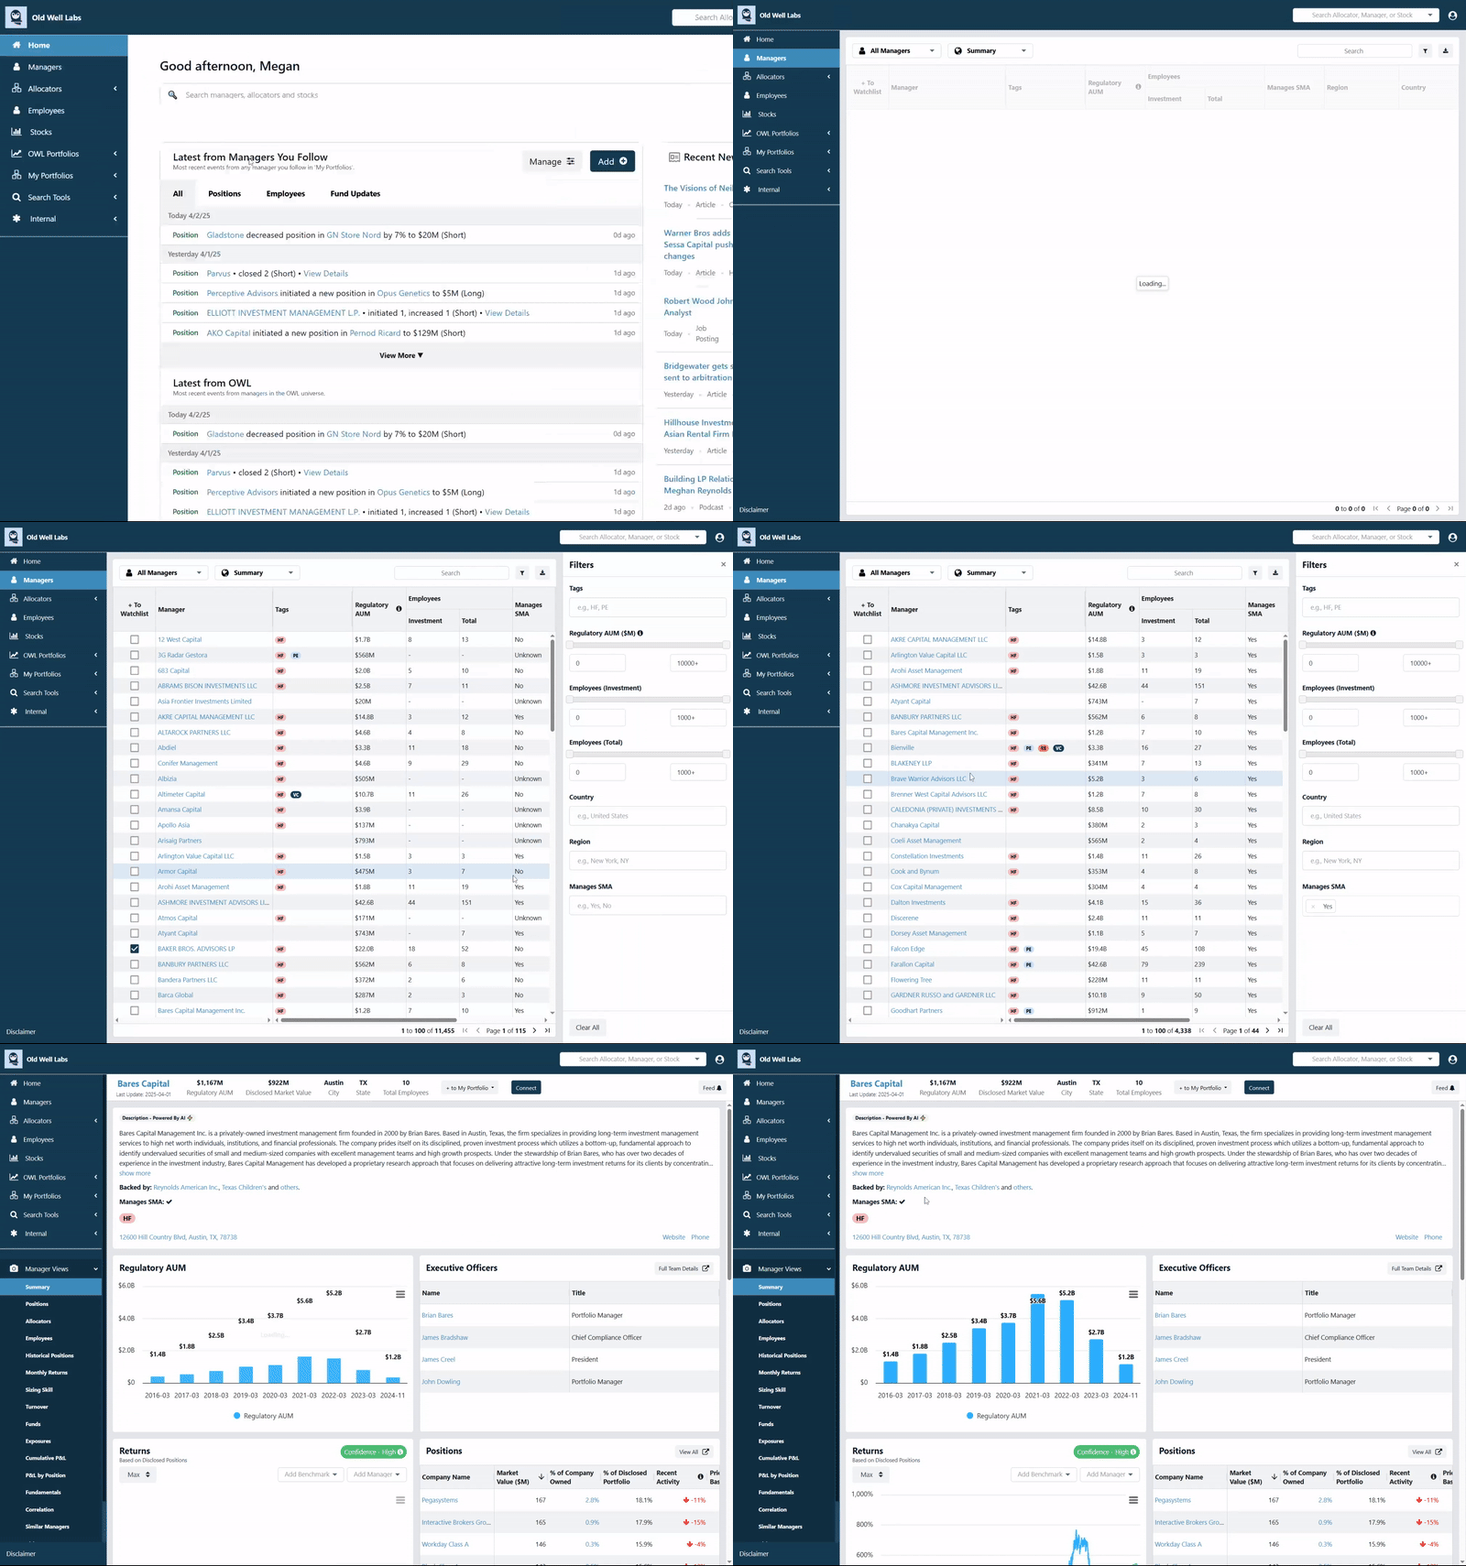
OWL users can now search through our database of over 13,500 managers and filter by whether the firms manage any capital via an SMA, or Separately Managed Account. Users can filter for this metric in OWL’s manager table and it’s also noted at the top of each individual manager profile. More than 4,000 managers in OWL disclose that they have an SMA.
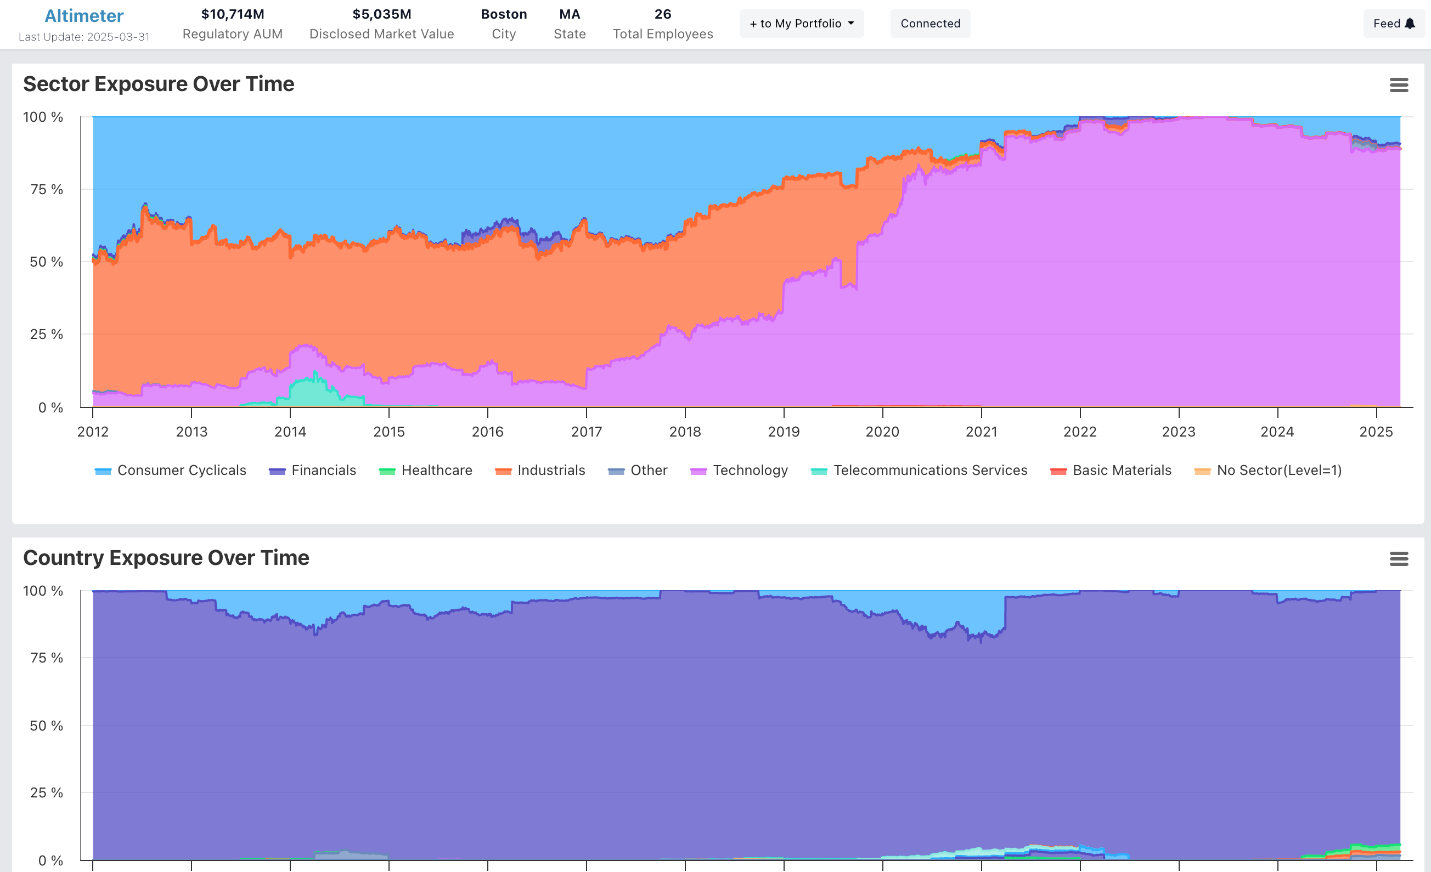
We updated our Exposure page to align with the rest of OWL’s design system and make it easier to see all the data together. Users can now see a manager’s exposure over time by sector, country, market cap, and factor, all on one screen.
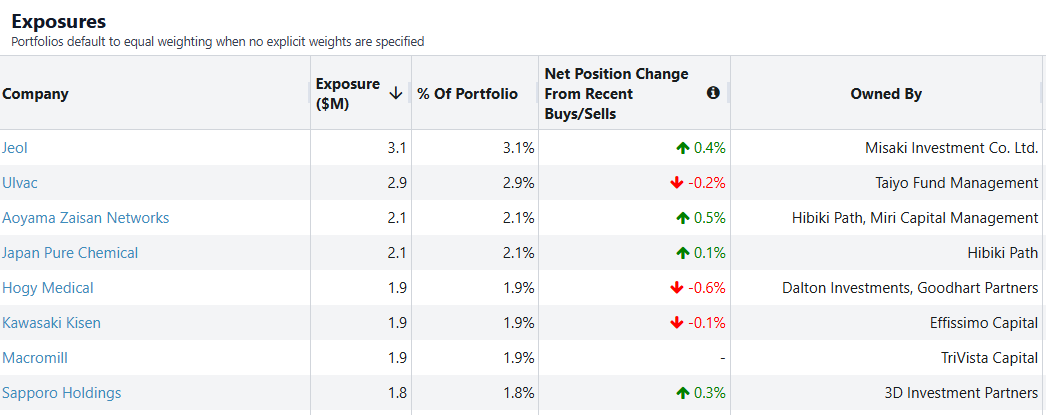
Within a user’s custom “My Portfolios,” we introduced a new column in the exposures table: Net Position Change from Recent Buys/Sells. This shows the percentage of a portfolio allocated to recent buying or selling activity, helping users distinguish between positions that grew due to price movement and those that reflect recent manager conviction.
One of our customers asked for this analysis recently, and we’re excited to roll it out to all users.
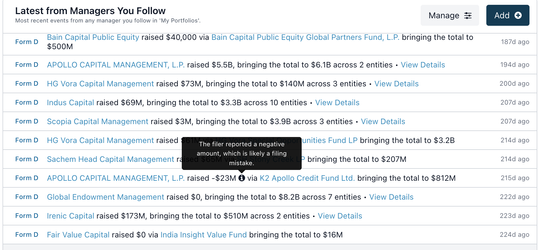
Occasionally a manager makes a filing error on a Form D that results in a negative value for dollars raised. You’ll now see a flag noting when this is the case, mitigating any confusion the filing error may cause.
We continue to expand the breadth and depth of our data. In March, we added:
- 1,250 managers to reach a total of 13,500
- Employee data for 1,300 managers
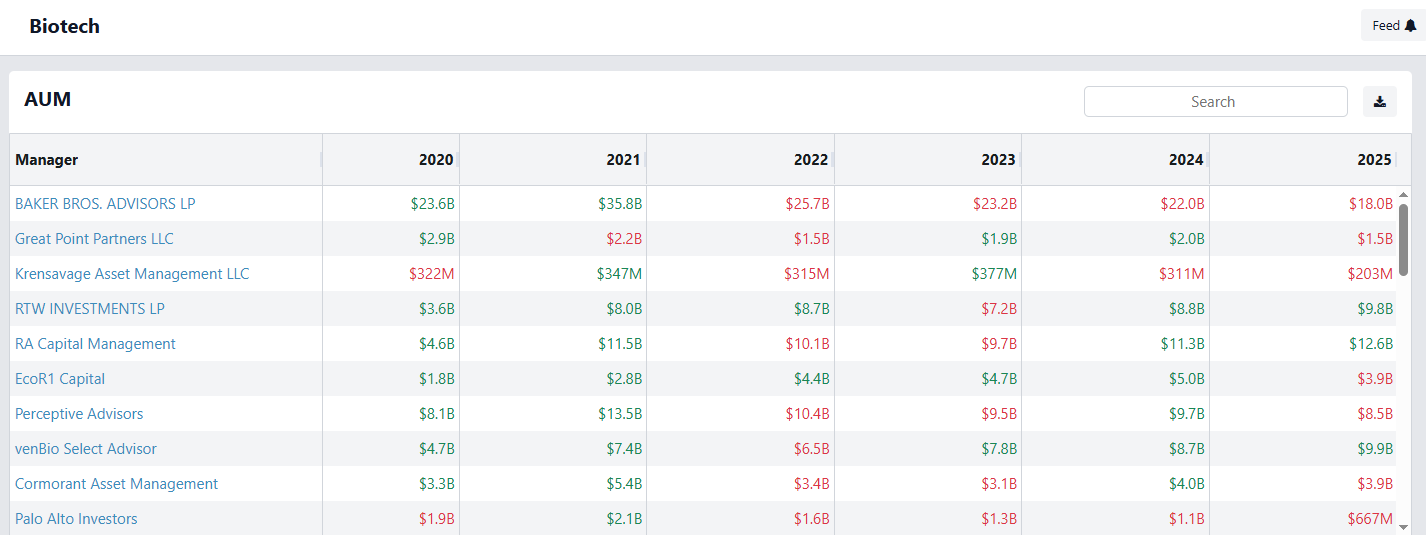
- Updated ADV data for 7,000+ managers, including updated AUM, headcount, and internal capital. As a reminder, users can easily see ADV trends for their custom portfolios in the “Business Trends” section:
Two of the features above were requested by customers, so please continue to send us your ideas and requests!
February 2025
In February, we rolled out several enhancements to OWL, making it easier for allocators to find, monitor, and connect with managers. We also strengthened our login security and refined the UI/UX for a smoother experience.
OWL users can now use additional filters to search for managers on the platform. In addition to other features such as name-based and map-based search, the “Managers” view on the left navigation of OWL now includes two ways to search and filter:
This new view includes all manager types in OWL including public equity, hedge fund, PE, VC, and real assets. Any of the 12,000+ managers in OWL that we have these data points for will be included in the results. Users can filter by:
- Fund Type (Hedge Fund, Private Equity, etc.)
- Regulatory AUM
- Team Size: Total Staff and Investment Team
- Geographic Information: Country and Region (City, State)
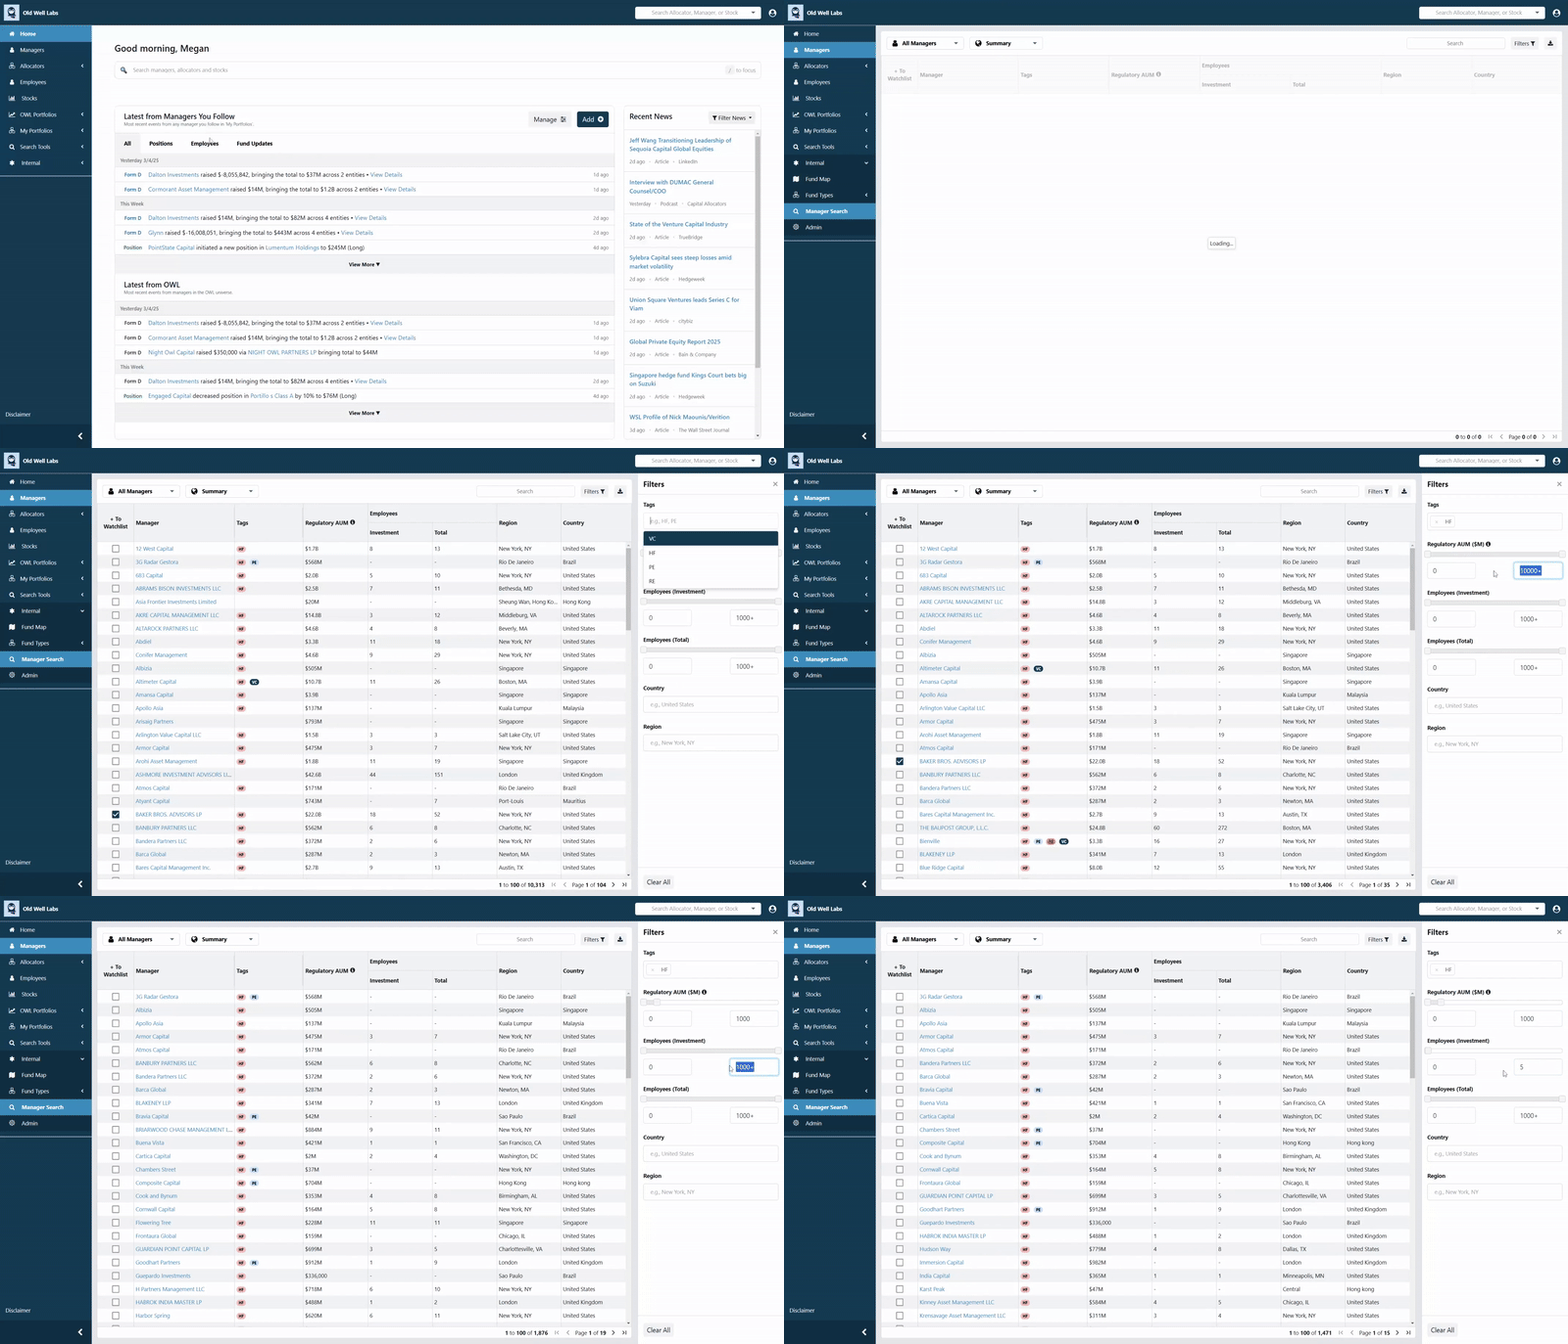
This view maintains our public equity-focused scorecard functionality, with the ability to filter the managers by:
- Fund Type
- Metrics (Returns, Alpha, Beta, etc.)
- Position Count
- Turnover
- Returns over several timeframes
We’ve also added a checkbox to add or remove managers from your watchlist, directly from these lists. When managers are added to your watchlist, you’ll see real-time updates for them on your dashboard and their key events (team changes, position changes, etc.) will be included in your email alerts.
A ‘Connect’ button now appears on every manager’s page, allowing allocators to request connections with those managers directly within the OWL platform. Our users frequently tell us they discover managers on OWL with whom they want to connect to learn more, and we love facilitating those warm introductions. This button is a small but important first step in bringing that activity inside the platform. We launched it last week, and even before announcing it (until now), it has already been used to facilitate several introductions between allocators and managers.

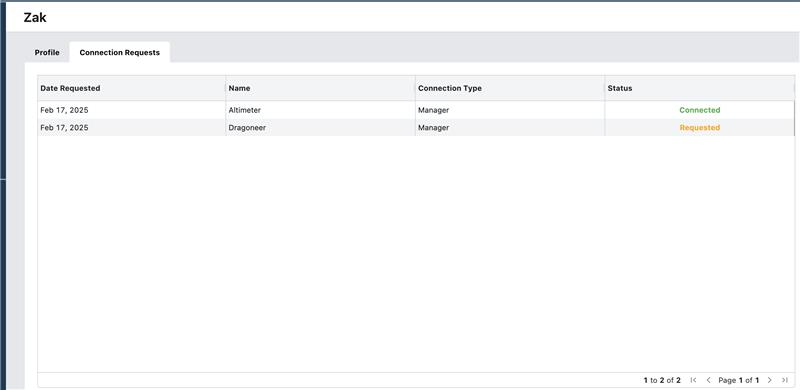
Users’ My Profile section (accessible on the top right menu) now features a dedicated tab that lists all connection requests with details including request date, manager name, and current status.
We've significantly improved how we track team changes, enabling us to capture these changes more accurately and promptly. Thanks to recent process improvements, we've achieved two major quality advances.
- More Accurate and Detailed Data: With our new process, we identified 15K job changes from the most recent month, compared to 5K previously with our legacy process
- Reduced Time Lag: You'll now see January job updates and even some early February changes, with the overall reporting lag reduced by two weeks vs. our prior process
For users that have set up portfolios of managers to follow, these changes will show up on your dashboard as soon as they’re in our system and will be included in your email alerts.
Our improved data operations process also allows us to fix incorrect mappings more quickly and consistently. People data is inherently messy, but in the coming months, users should notice better quality people data for smaller managers, providing more comprehensive coverage.
We’ve enhanced the security of our login for those users who would like to use Multi-Factor Authentication. Simply head over to My Profile section and enable 2FA.

Consistent Sidebar State: The sidebar now retains users’ preferred open or closed state as you navigate between pages. If you close the sidebar, it stays closed until you choose to reopen it. This also applies to the news section on the landing page – users can choose to keep it open or closed by default.
Menu Bar Icons: We’ve replaced the old icons with a sleeker, more intuitive version that better aligns with our design. The toggle in the bottom-left corner has been removed.
We're excited to get our users’ thoughts on these new features and welcome your feedback as we continue to evolve the platform. Keep the ideas coming!
January 2025
January was a big month for OWL! We launched a completely redesigned landing page that allows users to quickly monitor important changes for the managers that they follow. We also added an industry news feed and activity feeds at the portfolio and manager level to show recent events for those groups.
When users login, they will now see a new personalized feed designed to surface key updates for the managers they follow. This includes:
- Stock transactions
- Team changes
- Fund updates (e.g., capital raised, new funds launched)
In the coming months, we’ll be adding even more data and functionality to this feed, including the ability to follow allocators and track their investments and team changes.
The best way for users to maximize this feature is to add managers to their “Watchlist,” which can be done by clicking the “Add” button on the homepage. Once a manager is added to the Watchlist, users will receive updates on them via their dashboard and weekly email alerts.
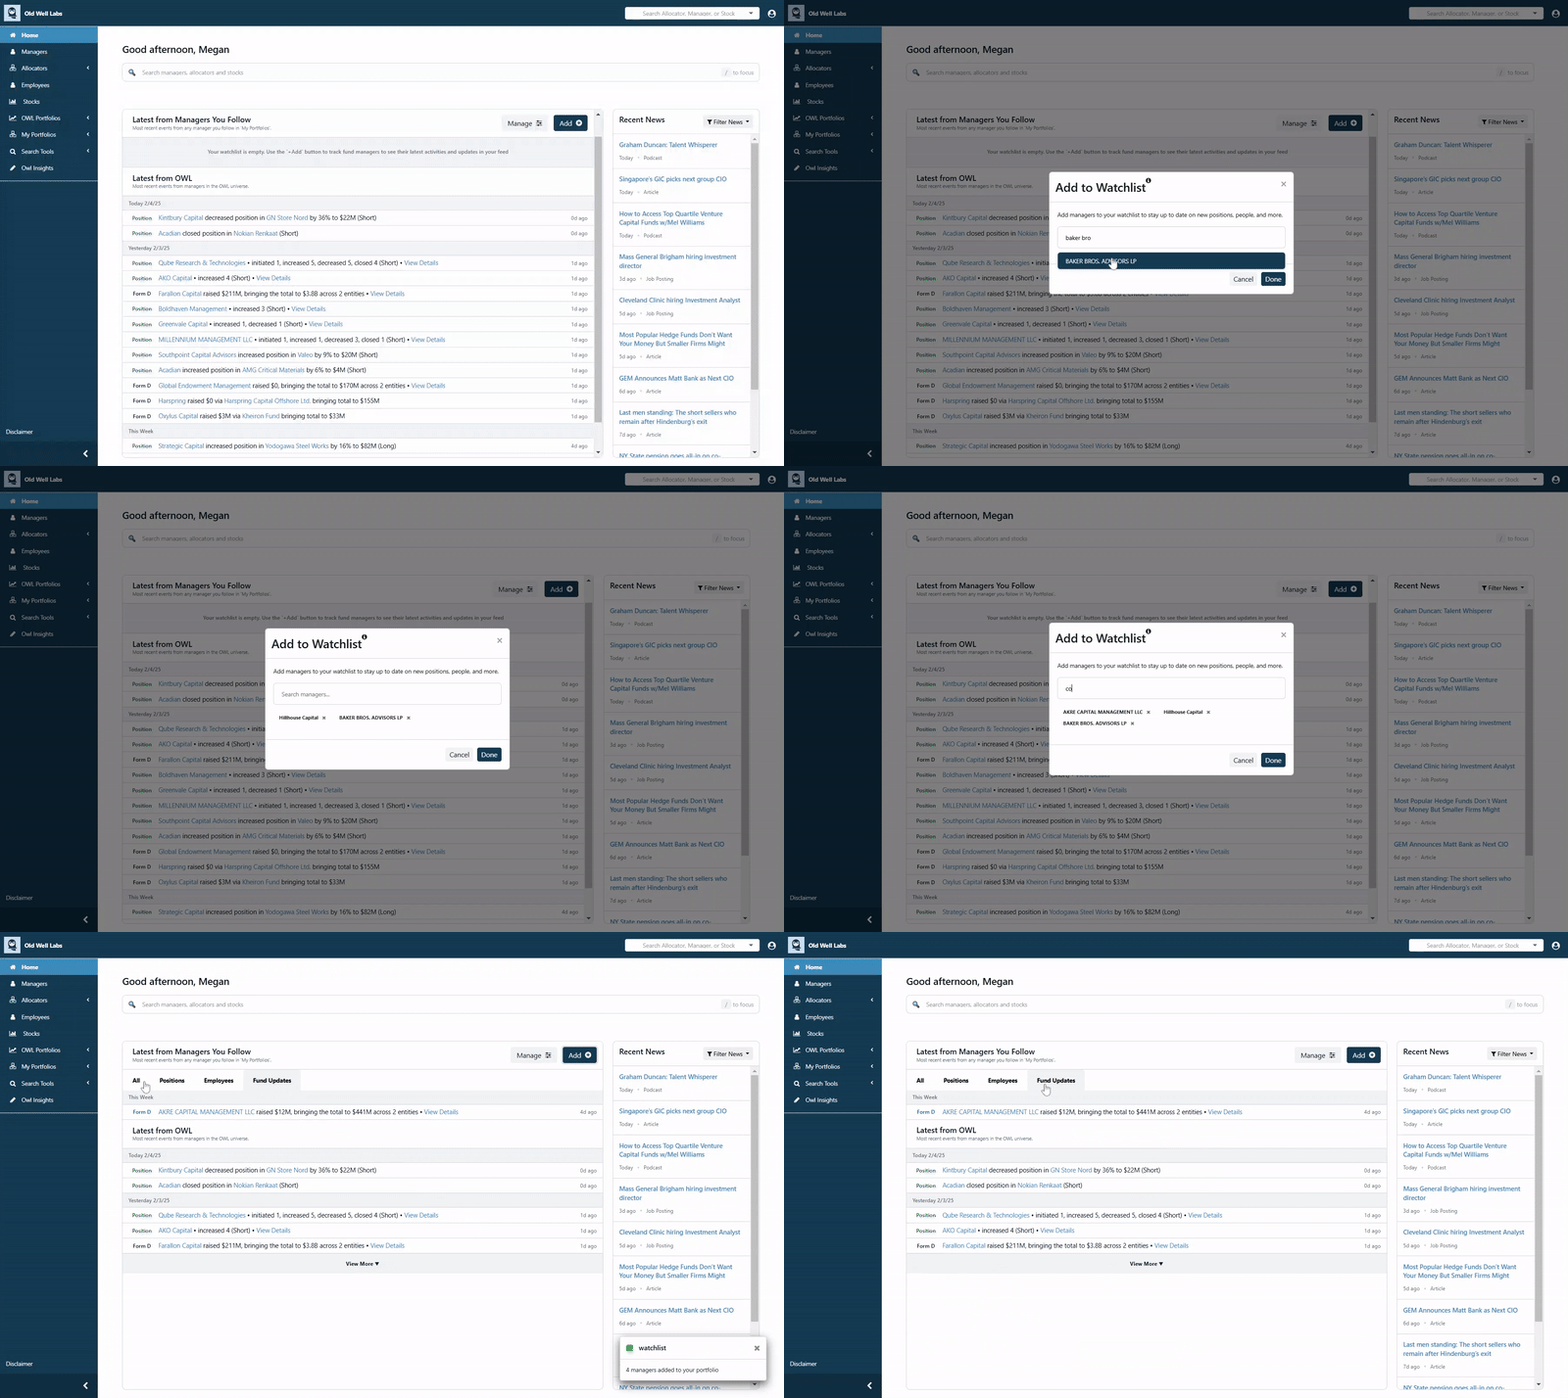
The right side of the landing page now features an integrated news feed with category filters for Job Postings, Articles, Podcasts, OWL Insights, and more.
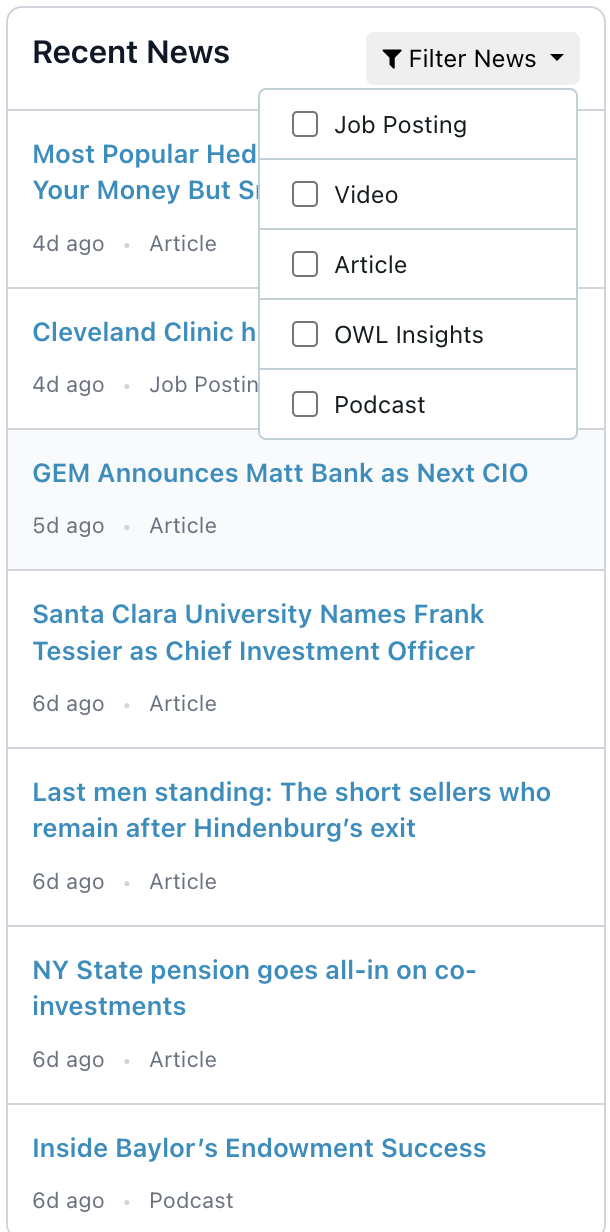
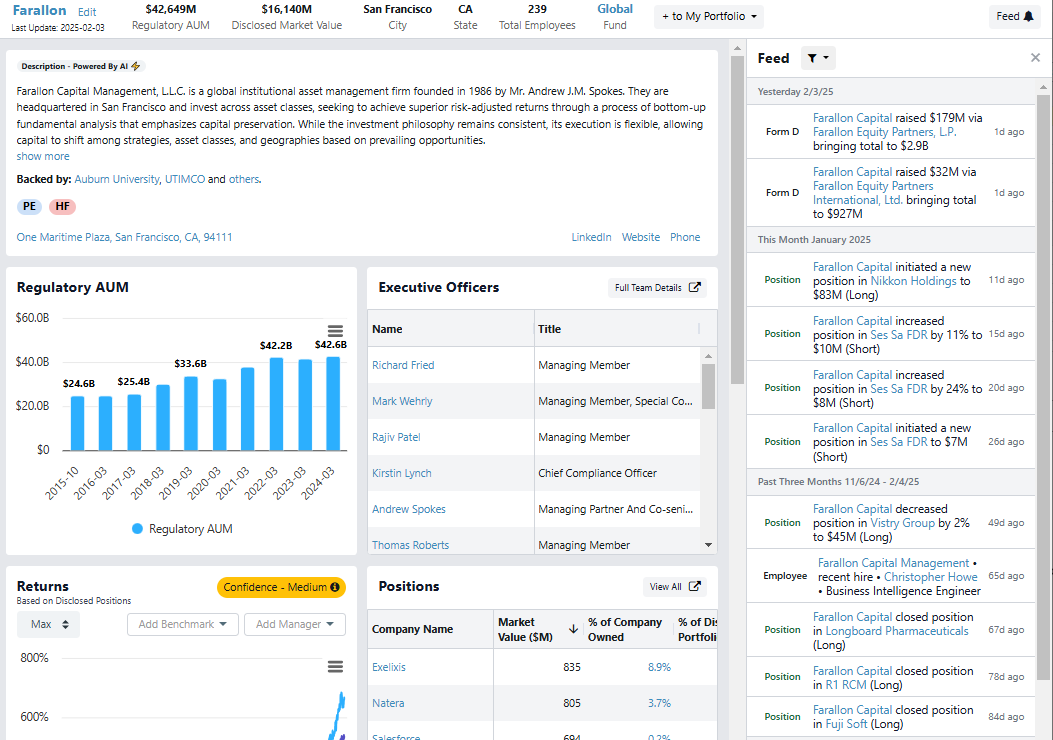
In addition to the main dashboard, we’ve added activity feeds across OWL for both manager profiles and user portfolios.
- Click the “Feed” button in the top right of any manager profile to see recent events related to that manager.
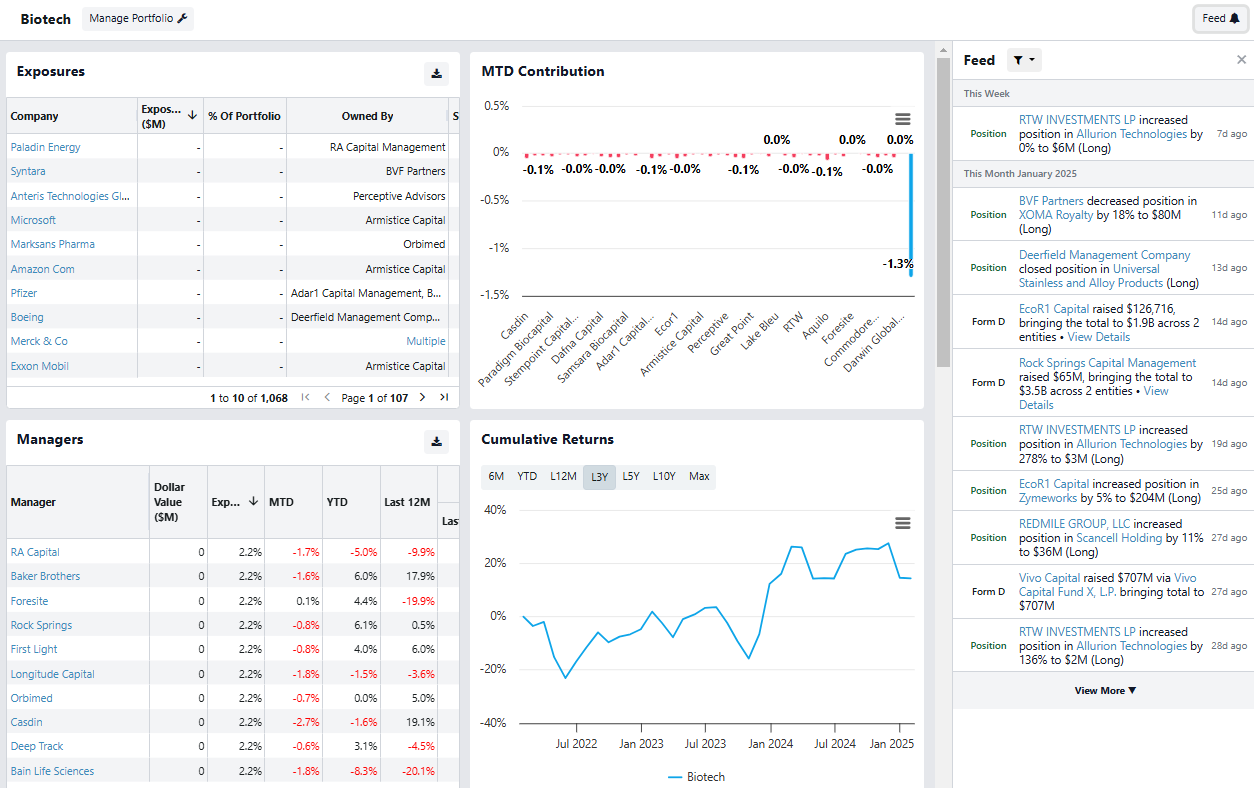
Users can also see an activity feed at the portfolio level, both for the standard OWL Portfolios and any portfolios that they have created.
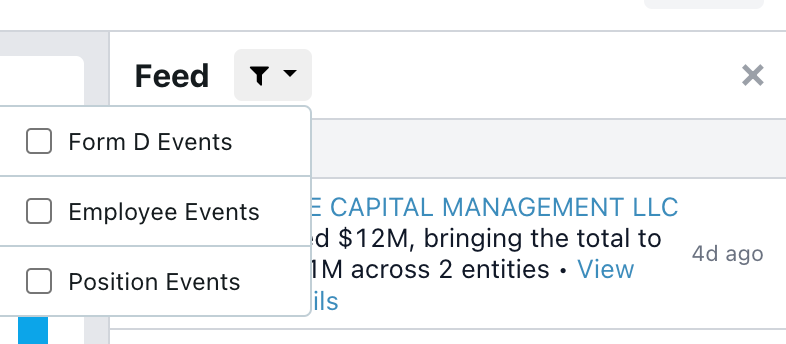
Each activity feed also allows you to filter for specific types of events:
While the revamped dashboard and news feeds were the primary focus for January, we also made some subtle but impactful UI/UX improvements to simplify and modernize the platform:
- Consistent UI elements: Simplified dropdown menus and filters across pages.
- Softened color scheme: Reduced visual noise for a cleaner, more cohesive look.
- Improved spacing: Enhanced table and filter layouts to reduce clutter and improve readability.

January’s updates were a big step forward in creating a more customized experience for our users, which we will continue to build on in the coming months. Please continue to give us your feedback and ideas!
December 2024
As we enter 2025, we’re excited to reflect on some of our favorite enhancements that we introduced to our platform during 2024. Here’s a high-level view of some of the key updates from 2024:
- Email Alerts: We introduced an email alert system that proactively updates users about significant events for the managers they follow, including team changes, new fund offerings, and public equity transactions.
- Manager Database: We increased the number of managers on our platform from 3,000 to 12,000+ in 2024, substantially expanding the data available to our users across asset classes.
- Location Search: Users can now search and filter managers by location, as well as other criteria, including size and asset class, helping allocators plan travel or find managers in a given location.
- Form D Data: OWL users can now see historical data on capital raised at the individual fund level. Form D data is also valuable to help find and monitor new fund launches.
- Employee Dashboard: This new feature offers an overview of notable employee movements across the 12,000+ fund managers we track, with the ability to create a dashboard of employee changes for the managers that OWL users follow. The dashboard also has email integration and export capabilities, enabling users to monitor team changes efficiently.
- Expansion of Employee Data: Our people database grew significantly, now tracking over 1 million current and former employees at investment managers.
- Improved Allocator Data: The number of disclosed allocator holdings in our system expanded from 30,000 to more than 60,000 in 2024. A big driver of the growth was the addition of more than 20,000 manager investments across 200+ public pensions.
We hope these enhancements have improved our users’ experience and we look forward to bringing you more valuable updates in the coming year. Now on to the December Update…
.............................
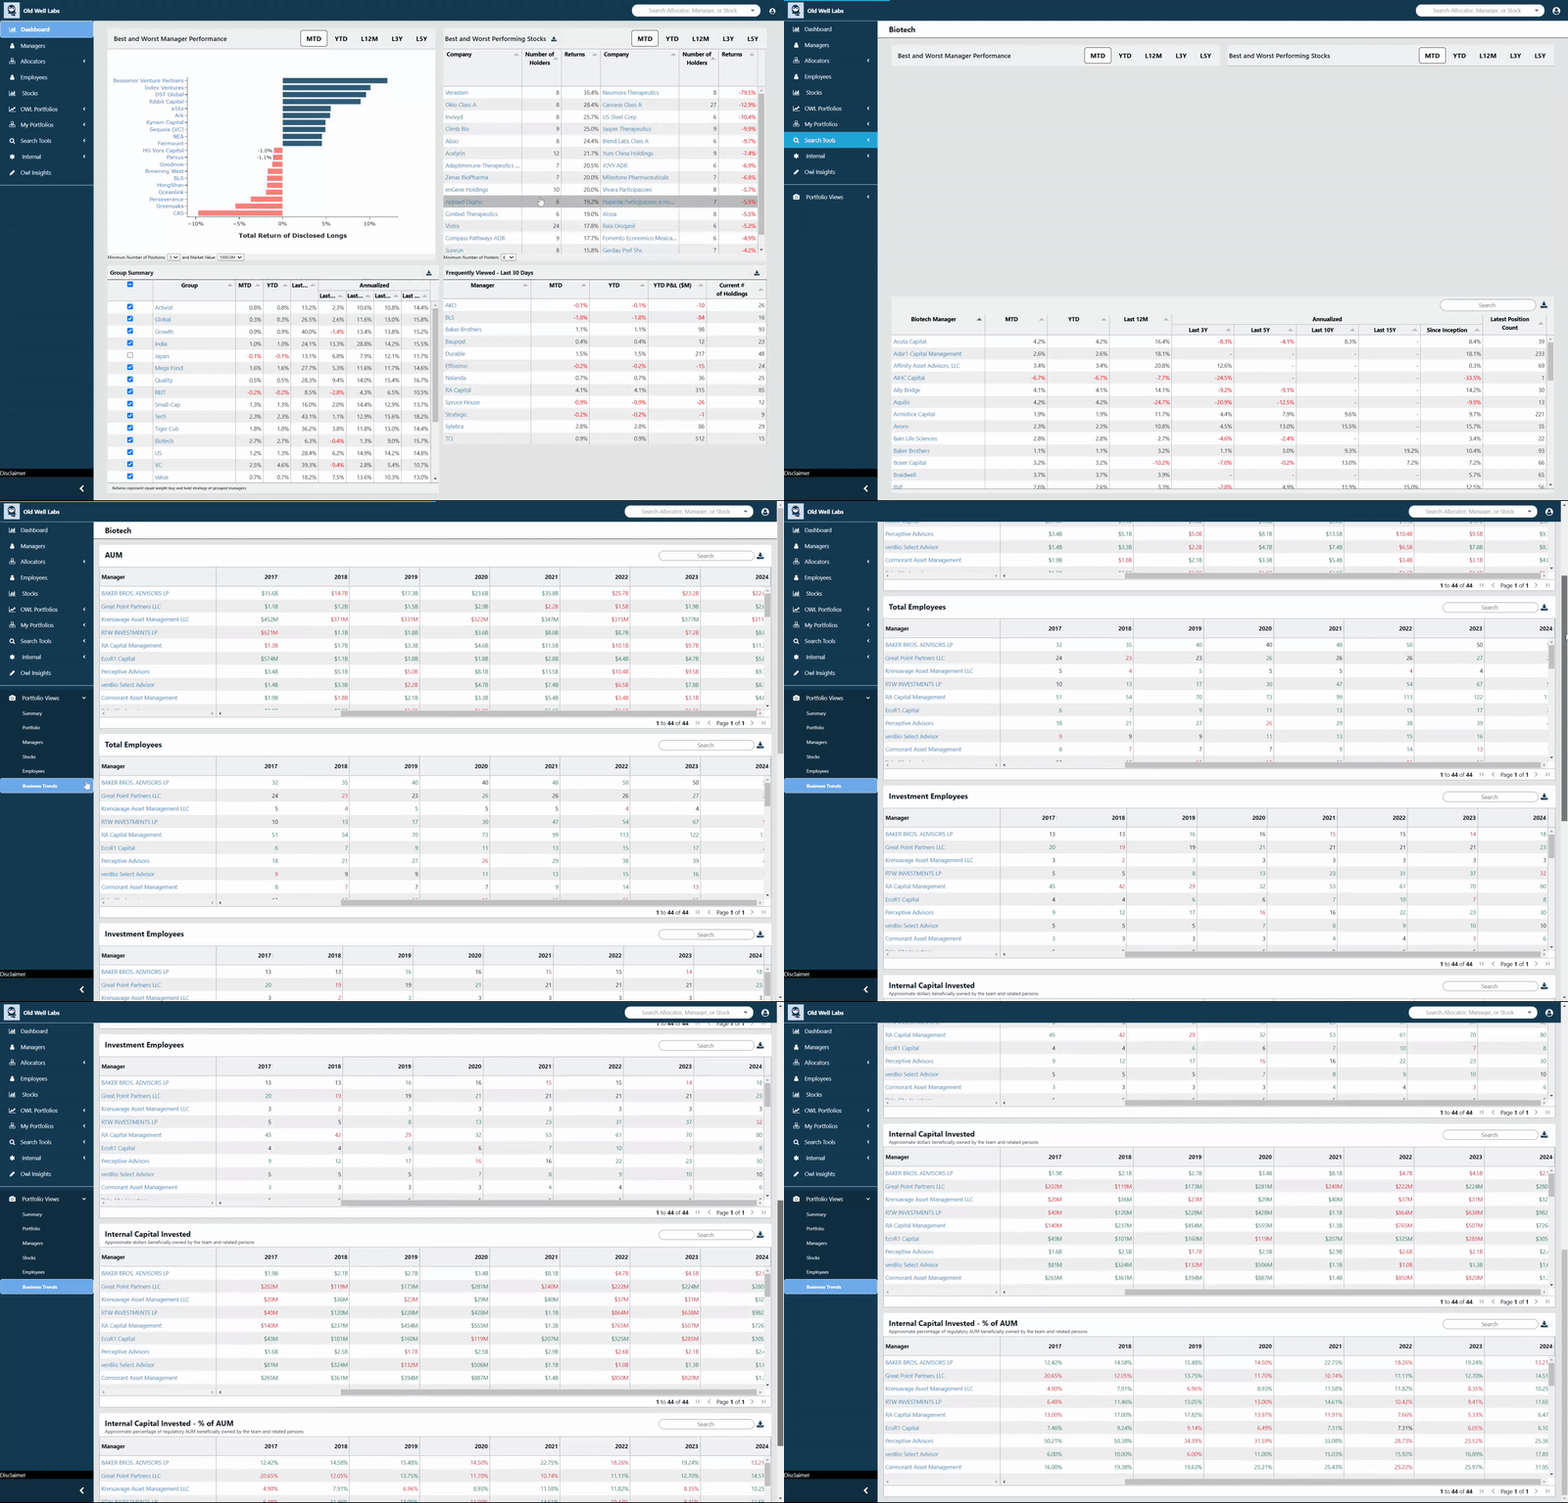
We introduced a “Business Trends” section under “My Portfolios,” allowing users to track and analyze business trends across multiple managers in one place, including trends in AUM, internal capital, and employees.
We’ve added OWL’s allocator data to each manager’s Summary page. Users can now see which allocators have backed a manager right below the manager’s description at the top of the page, with the option to click through to the full list of disclosed LPs.
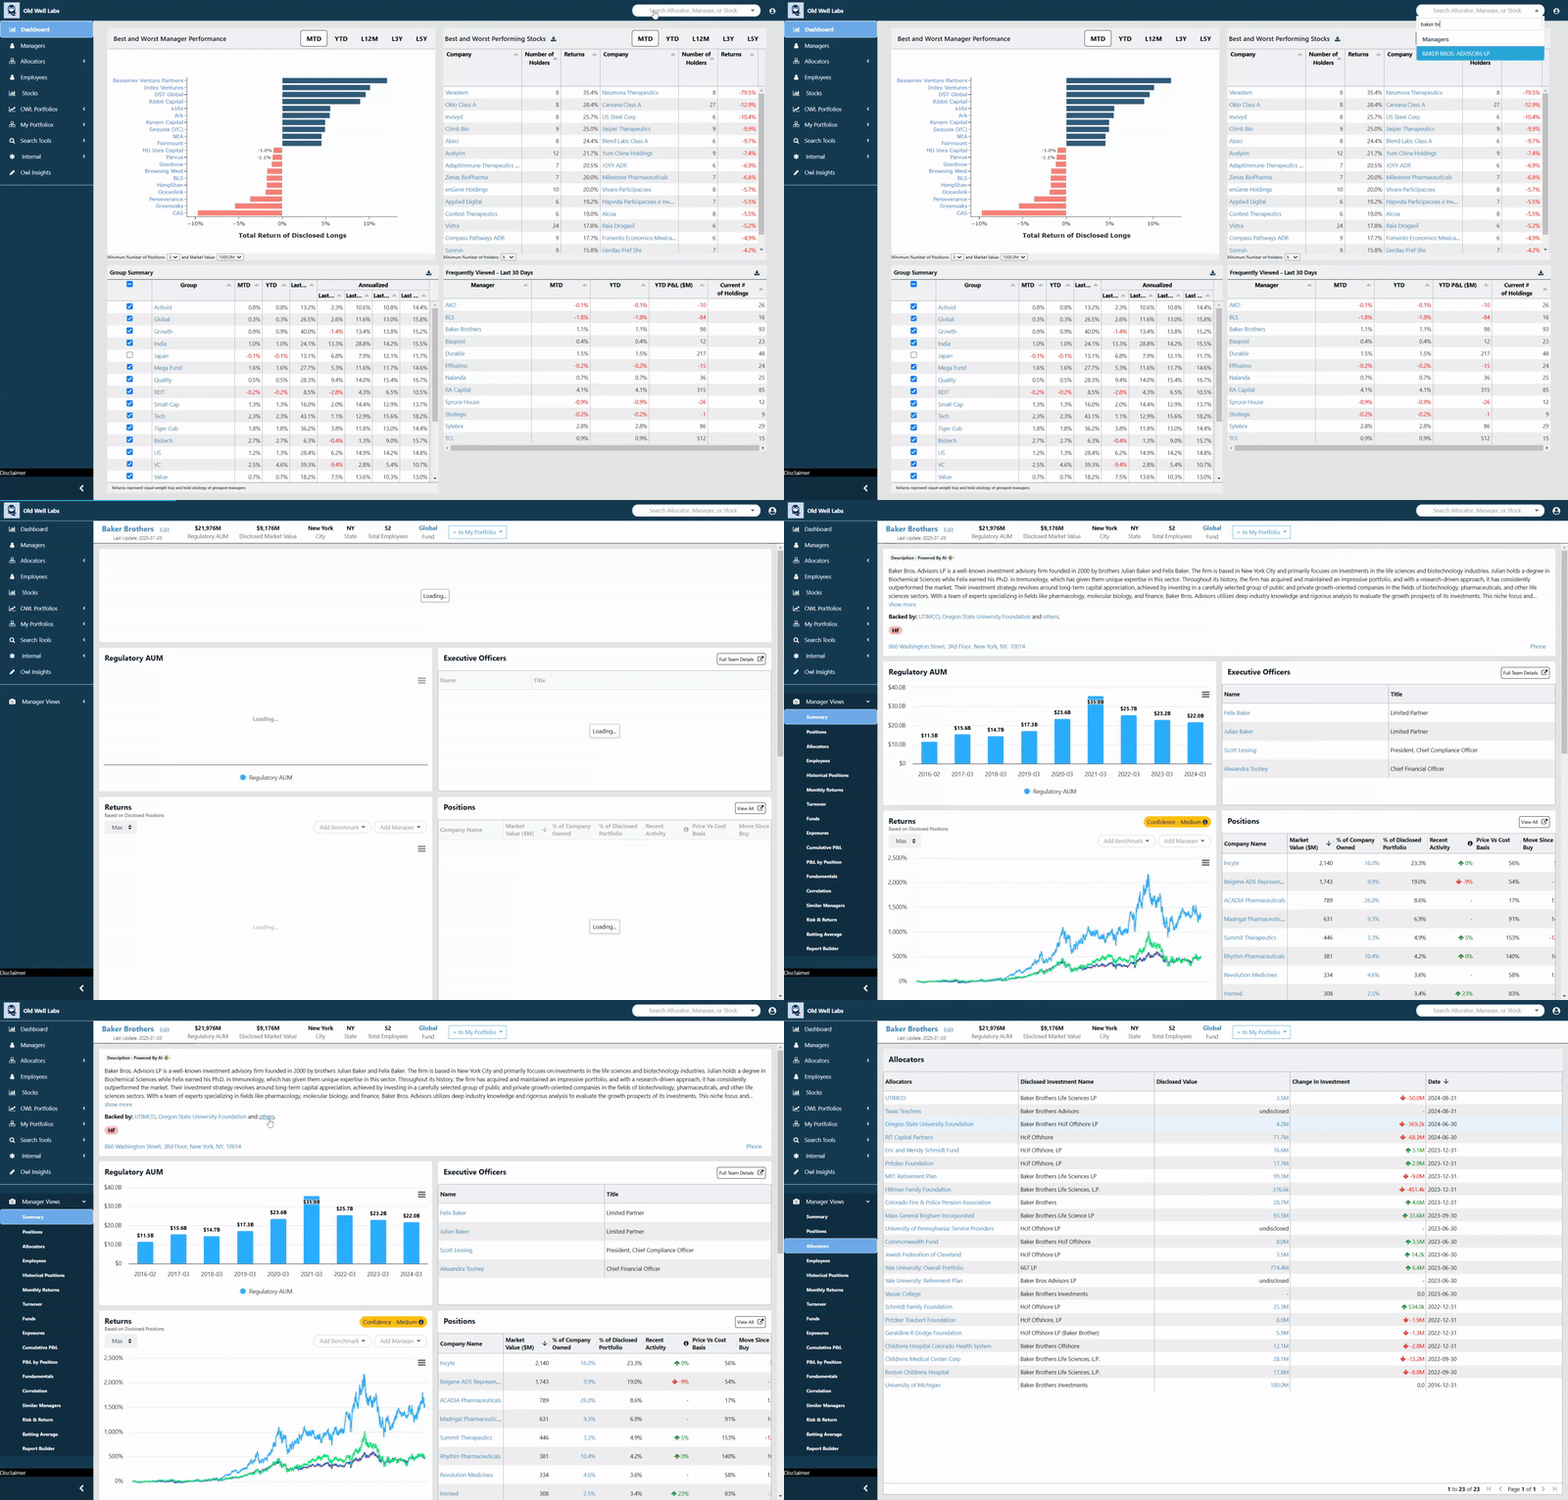
We updated all employee data in OWL, bringing the total number of employees in our database to over 1.15 million.
We simplified the map interface by removing unnecessary details, creating a cleaner and more focused experience.
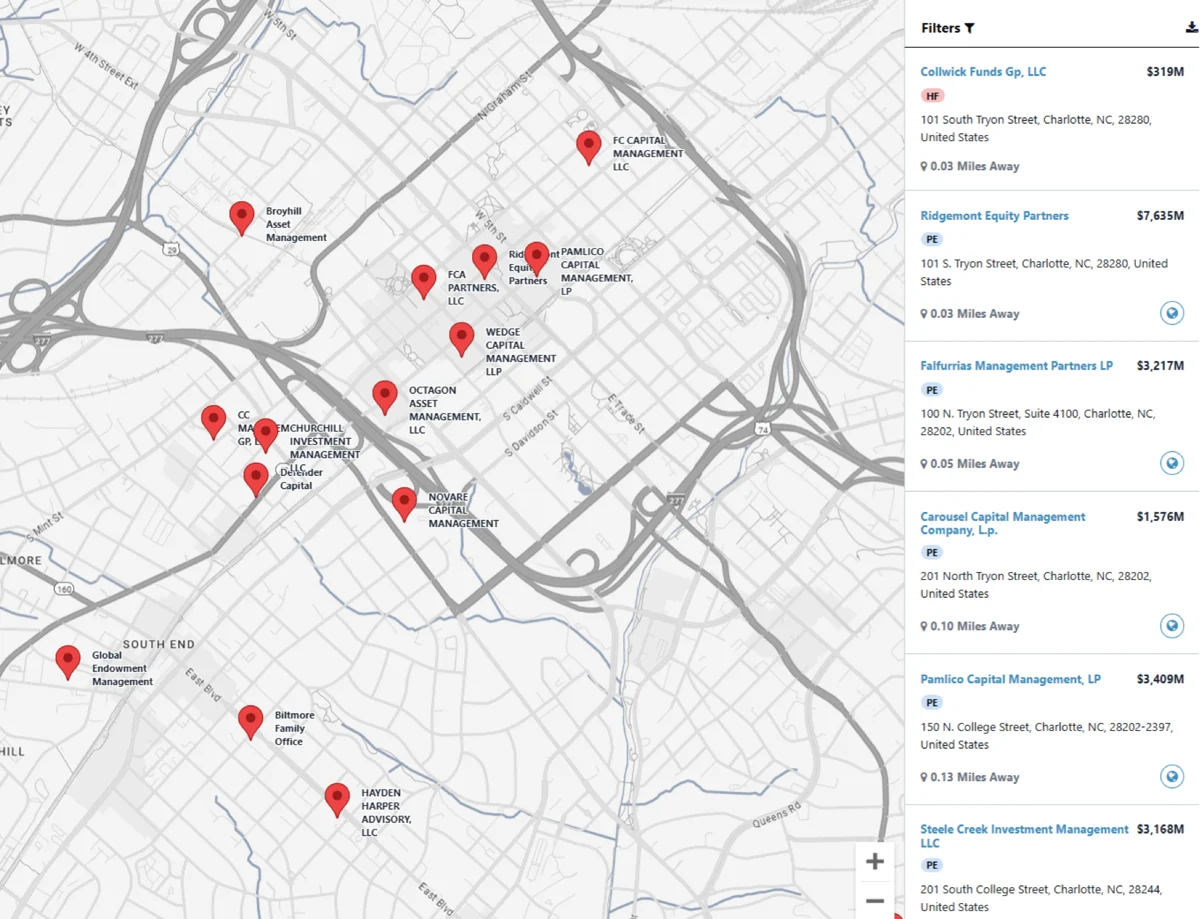
Allocator pages now load 3–4x faster and consistently load under one second, ensuring a seamless experience when accessing allocator data.
CSV exports now match the exact format displayed in OWL’s tables, ensuring consistency and usability. We also enhanced our chart exports, ensuring they render all data correctly with clear, useful titles.
Many of these smaller improvements, in addition to the larger feature releases, were based on user feedback and suggestions. Please keep sharing your ideas and pain points, and we will continue incorporating them into our product roadmap!
November 2024
In November, we continued to scale our employee data and international holdings data, enhanced our location search capabilities, and improved the user experience across tables and downloads.
We significantly expanded and refreshed our people data in November. Key updates include:
- 13,000 new individuals across ~850 new VC managers
- 182,000 people records refreshed for improved accuracy
- Reference cards optimized for faster loading
As part of our continued effort to track all of the disclosed stock holdings of the 12,000+ managers in OWL, we improved the way we gather EU data in November, adding additional data in Germany and the Netherlands. We added nearly 1,000 positions across both countries, and are continuing to add more data sources in Europe.
We believe that we have the most accurate and up-to-date endowment profiles in the industry. Given the number of endowments releasing performance and annual reports in October and November, we have been focused on making sure that information is quickly available to our users. We now have nearly 100 FY2024 returns on our endowment tracker, along with updated asset allocation and holdings data for any endowment that has reported it publicly.
We continue to add to OWL’s manager roster. In November, we added close to 1,000 managers, focused primarily on VC managers. We are now tracking more than 12,000 managers on OWL, up from ~4,000 in March. Examples of the new VC managers include (links will only work for OWL customers):
- Acre Venture Partners
- Jump Capital
- Vela Partners
We’ve updated the manager location search experience with a more consistent interface and new filters. Key changes include:
New Filters:
- Position Count
- Market Value
- Dollar Turnover
Updated Filters:
- Radius: Relocated and visually improved
- Tags: Matches the tags used elsewhere on the site
- AUM: Users can now select a range
Styling Enhancements:
- Adjusted slider widths and font sizes for uniformity
- Tags are displayed below the manager name
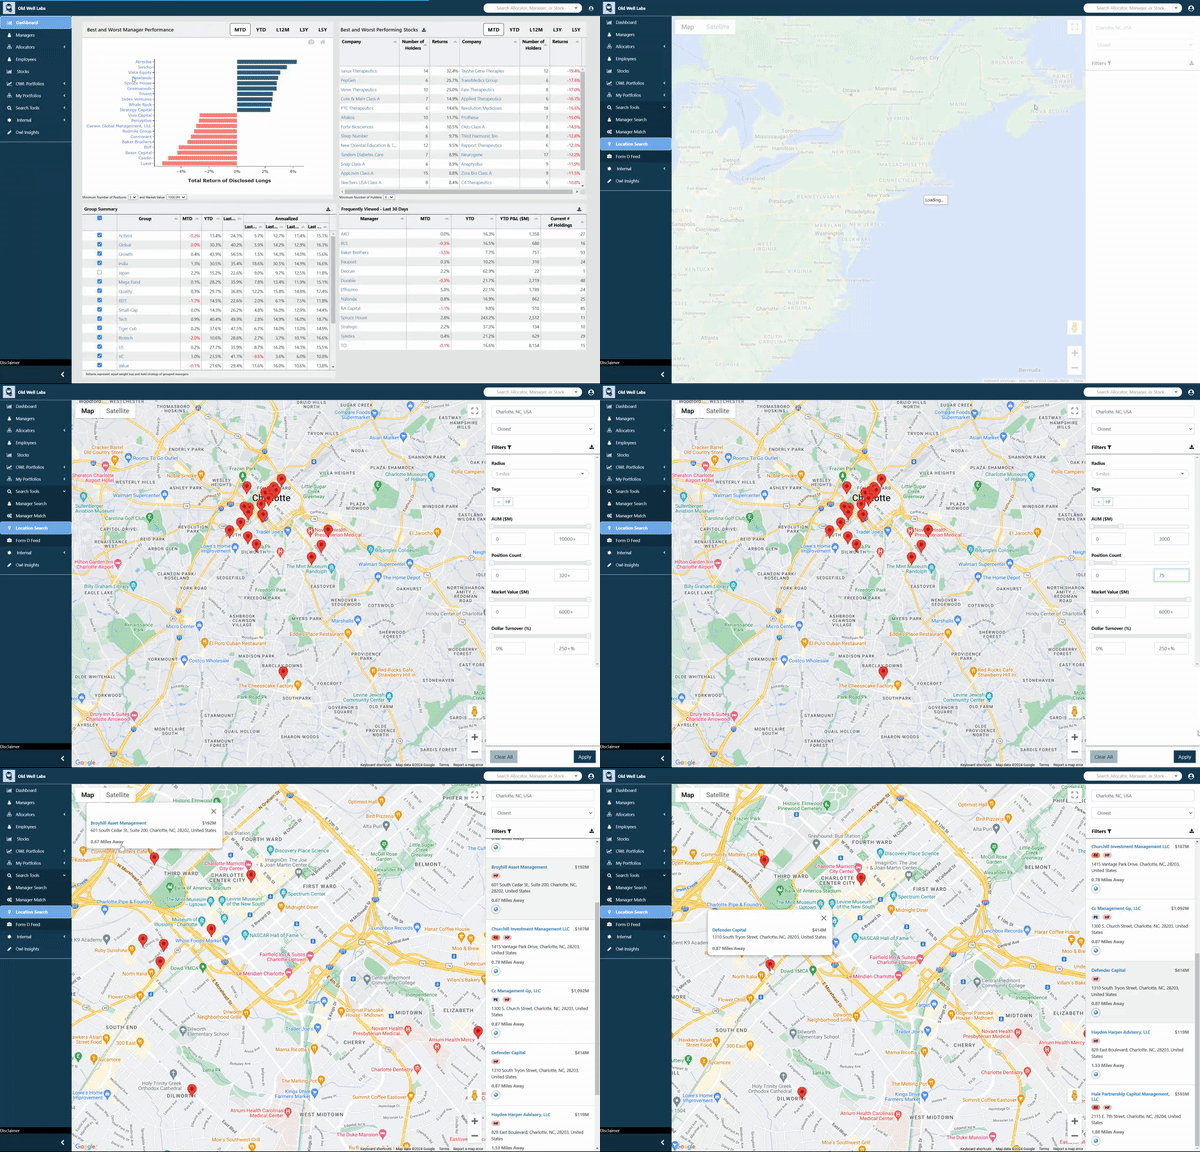
Clicking on an address on a manager page now clearly identifies the given manager’s location on a map. Using that location as an anchor, users can more easily explore other managers that are located nearby.
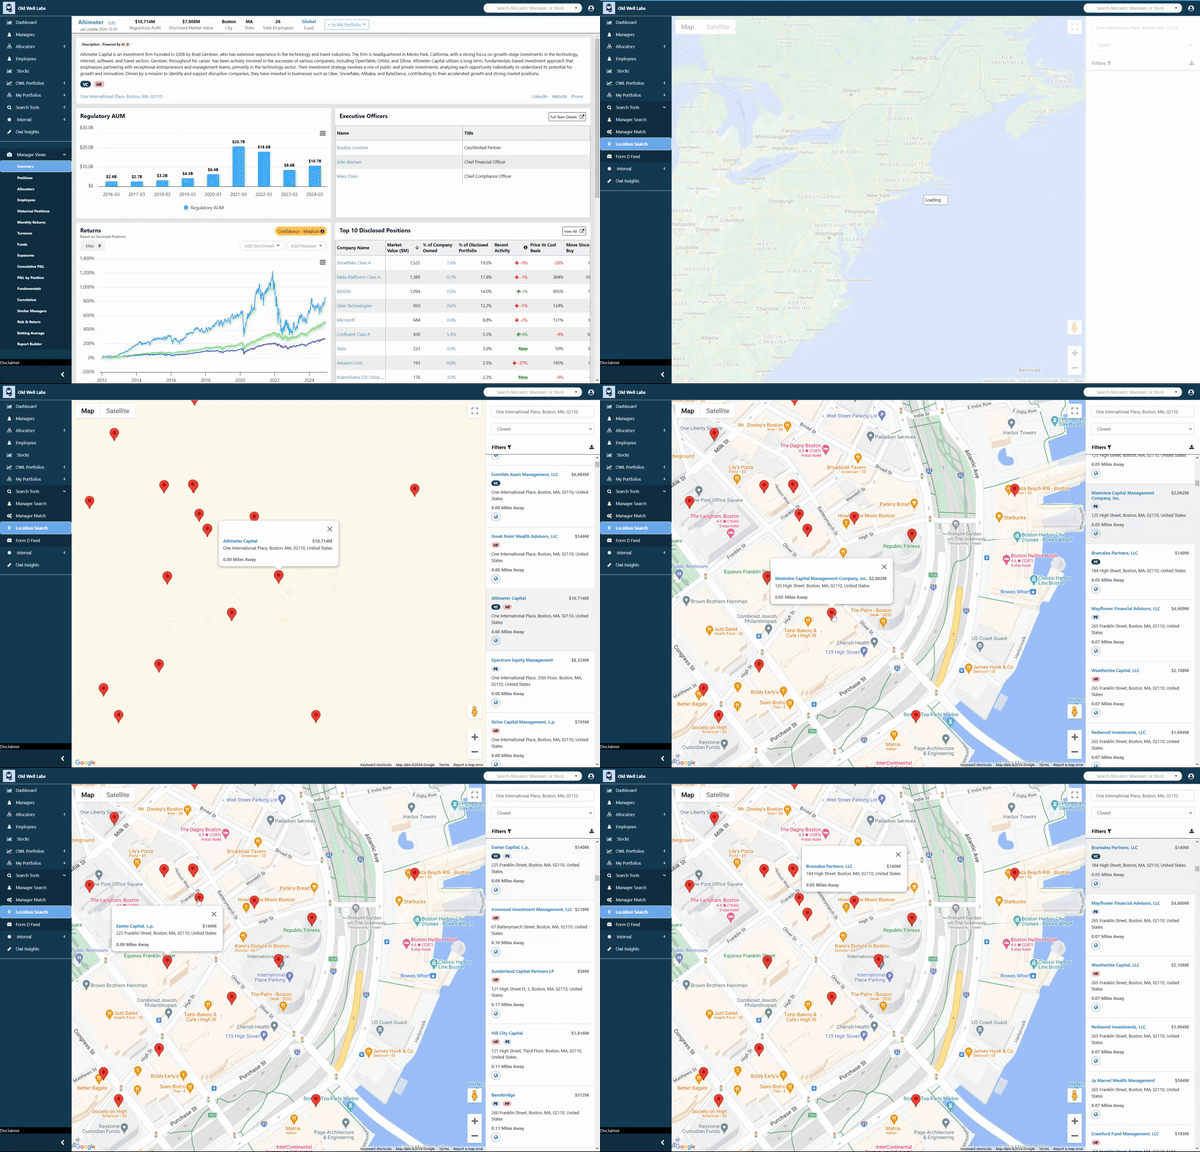
These location search improvements will make it even easier for allocators to discover new managers and optimize their travel plans.
To improve usability on all screen sizes, we’ve introduced a new table format across the site. The left-hand columns are now pinned by default, allowing horizontal scrolling for other columns. This is especially helpful when viewing OWL on a mobile device, which we find ourselves doing more and more!
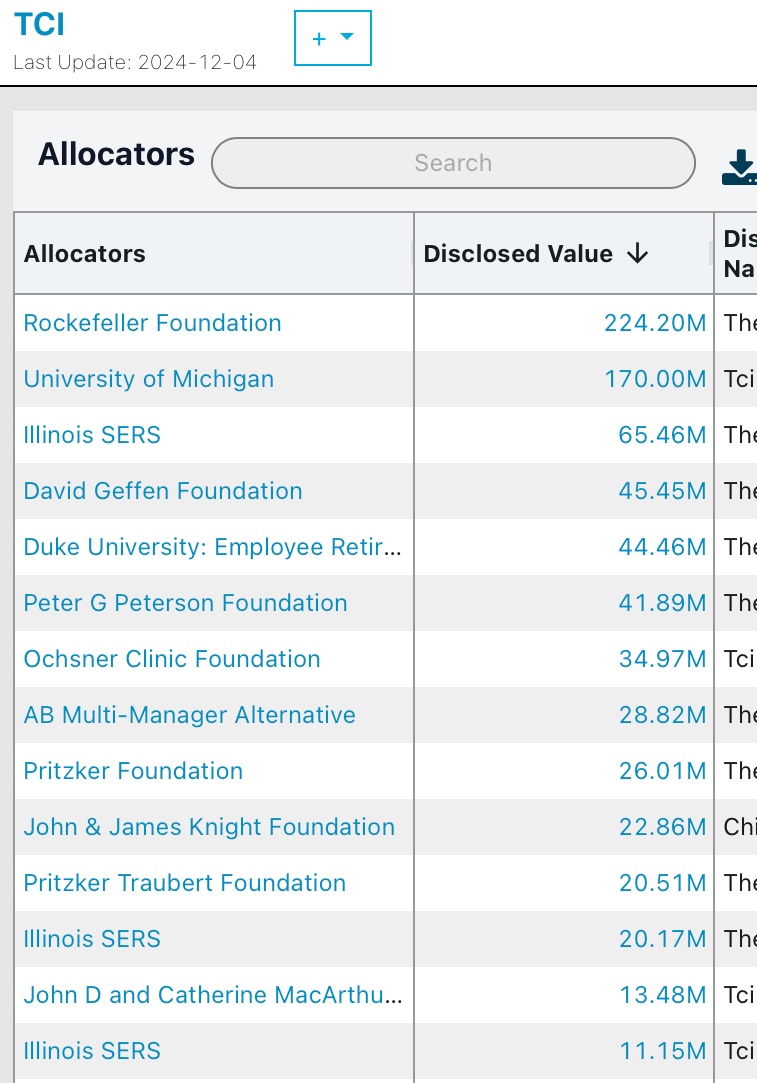
- Data downloads for employee data now include email addresses (where available) and LinkedIn info, making it easier to analyze employee data.
- Fund names across the platform now link to detailed fund pages, allowing quicker navigation within a manager’s various funds.
- Email alerts now include a link to aggregated employee changes across a user’s custom portfolio:

Many of these updates were based on user feedback and suggestions. Please keep sharing your ideas and pain points, and we will continue incorporating them into our product roadmap!
October 2024
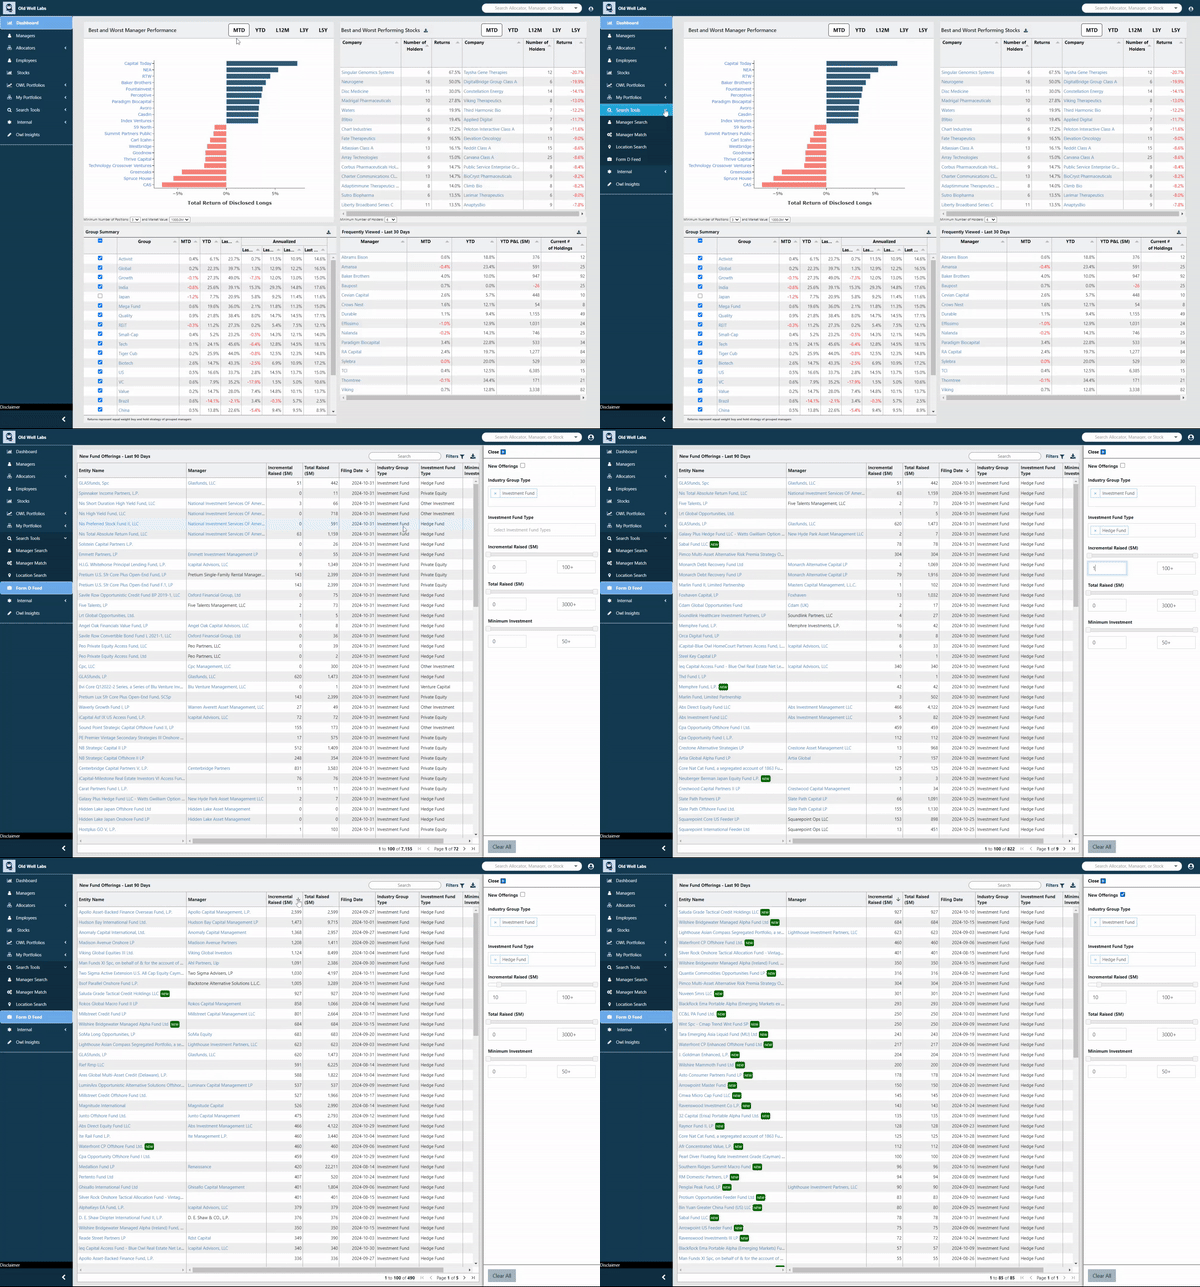
In October, we introduced new features including new ways to monitor employee changes, more detailed Form D dashboards, and over 24,000 manager investments disclosed by public pensions.
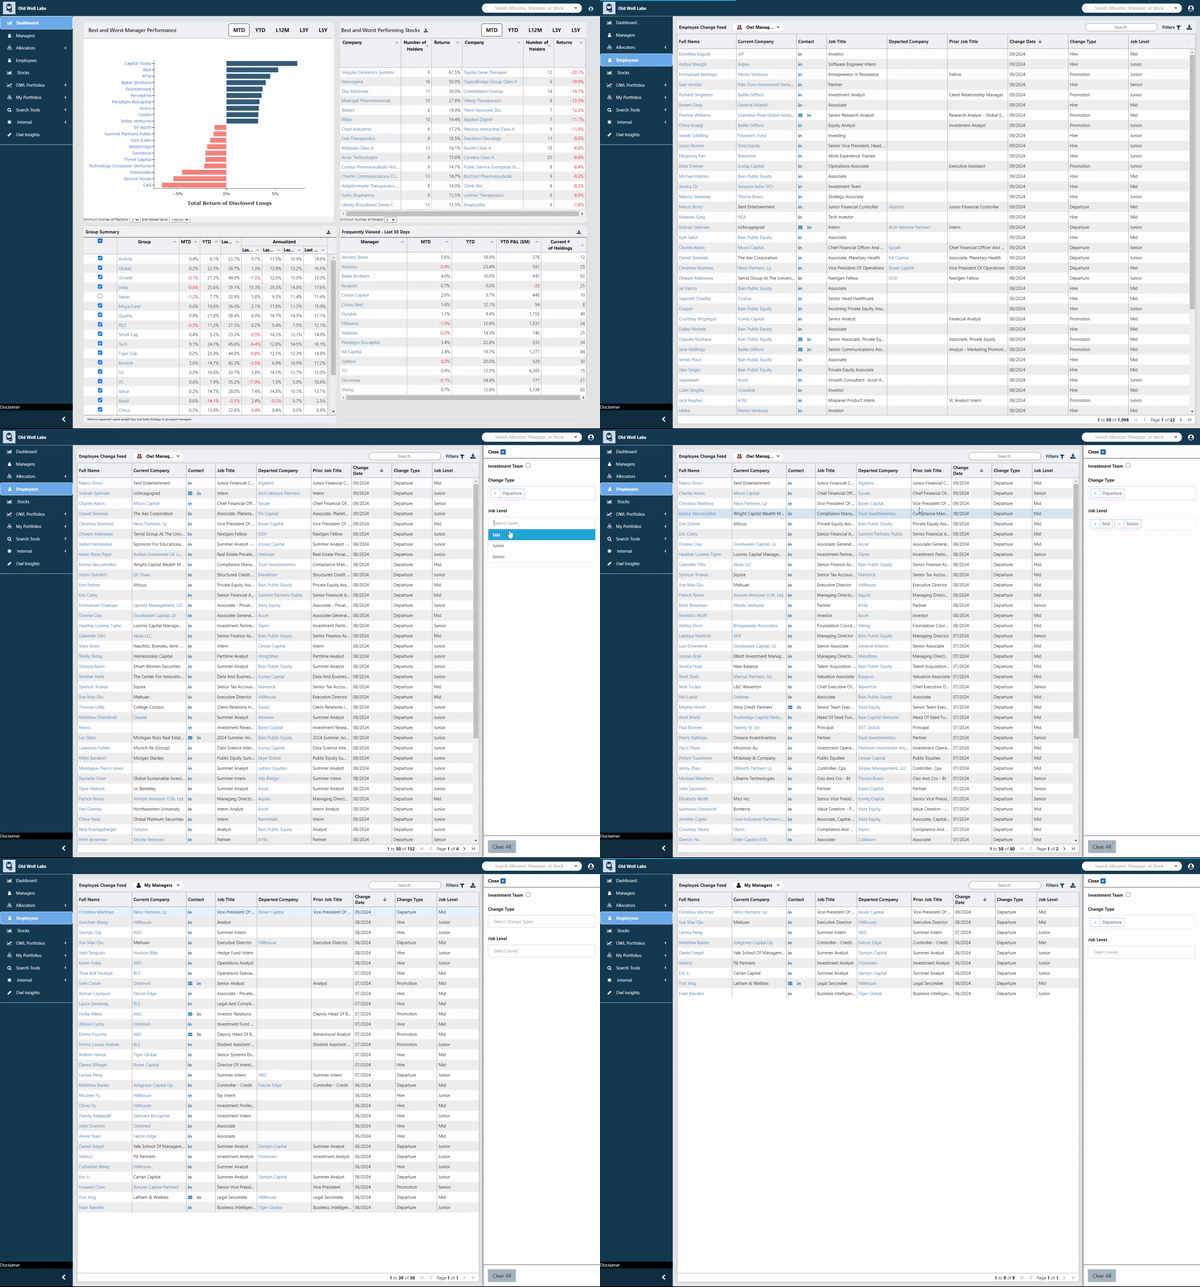
We’re excited to launch the Employee Dashboard as a new top-level feature. This addition provides a comprehensive overview of notable employee movements across the 11,000+ fund managers tracked in OWL. Users can access this by clicking on “Employees” on the main navigation bar on the left of OWL.
Here is what is in the new dashboard:
- Global and Custom Views: By default, users can see key changes across all managers in OWL’s custom groups if they click the new Employee link on the navigation bar. For a more customized view, users can switch to “My Managers” to see all employee changes associated with managers in their custom portfolios.
- Improved Interface and Filters: We consolidated tabs into a single table view for streamlined navigation, enhanced by filters for job level, team, and type of change.
- Enhanced Email Integration: We added direct links to email alerts for seamless dashboard access.
- CSV Export: All data is available for download for more in-depth analysis.
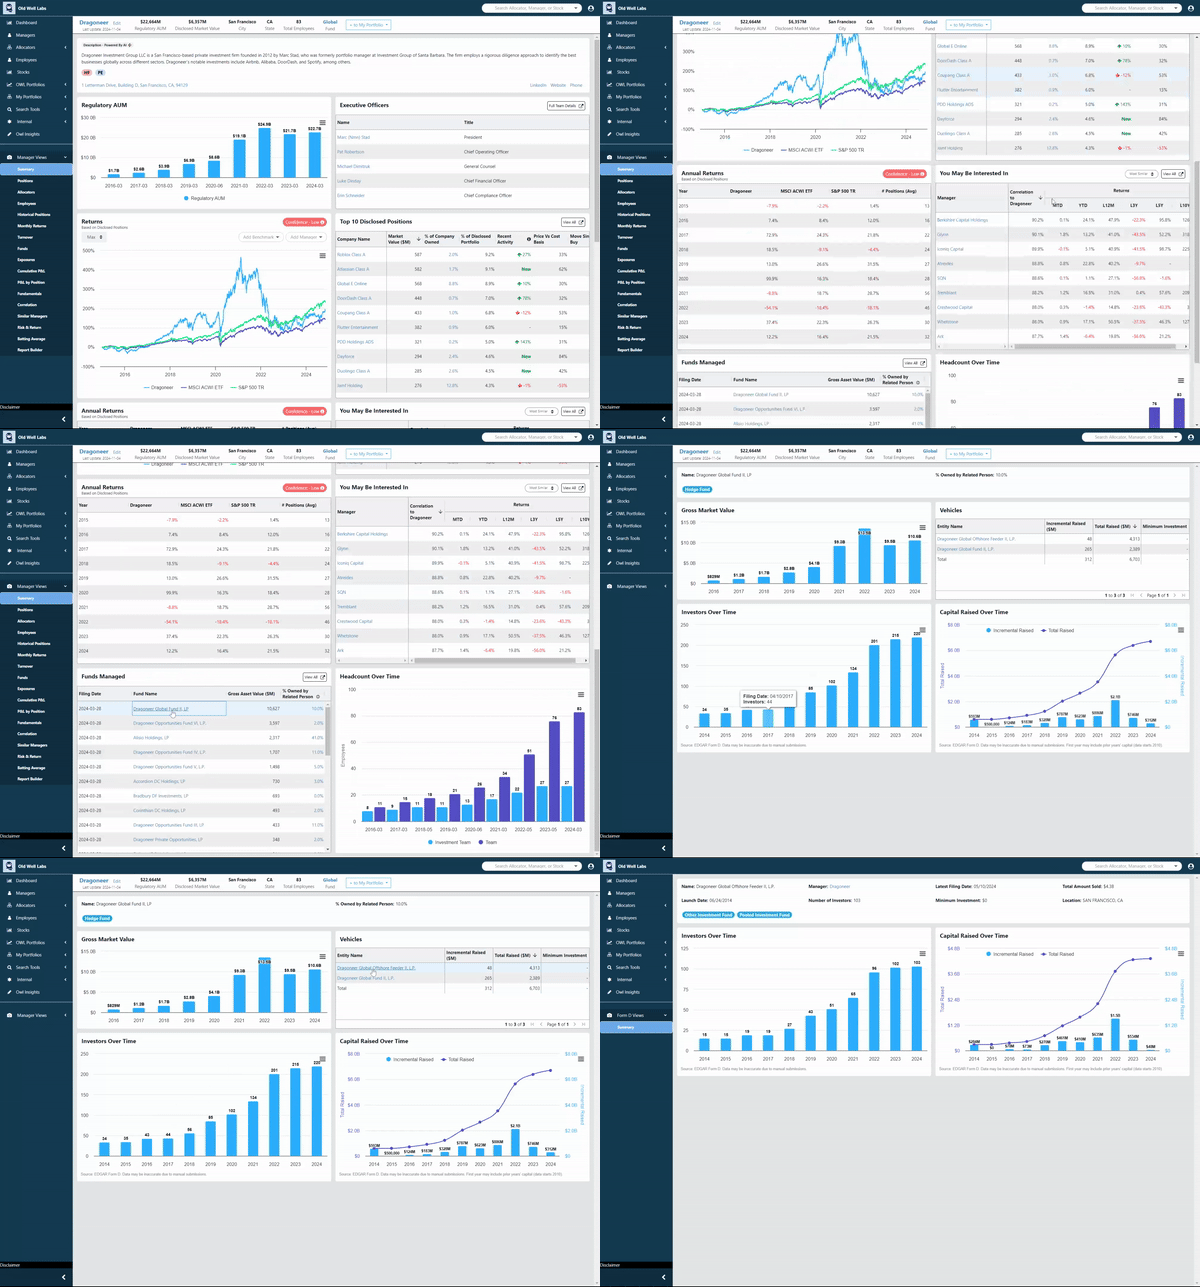
Form D Fund-Level View
In August, we launched an initial version of Form D data. As a reminder, companies and managers must file a Form D with the SEC when they raise capital for a fund. In October, we introduced a new view for Form D data, making it simpler to access key filing information and giving users access to more detailed fund info:
- Top Info Card: Displays the latest filing details with tags that can be filtered.
- Entity and Fund Levels: See data at the individual fund and vehicle (e.g., offshore and onshore) level, rather than at the manager level.
- Comprehensive Historical Data: Track number of investors and total capital raised over time by fund.
This detailed data is accessible through the “Funds Managed” section of the manager summary page and also under the “Funds” option on the lefthand manager navigation bar.
We continue to add crucial information to our email alerts. This month we added Form D data to go along with position and employee alerts. OWL users will now receive alerts when managers in their portfolios file a Form D, disclosing incremental capital raised.
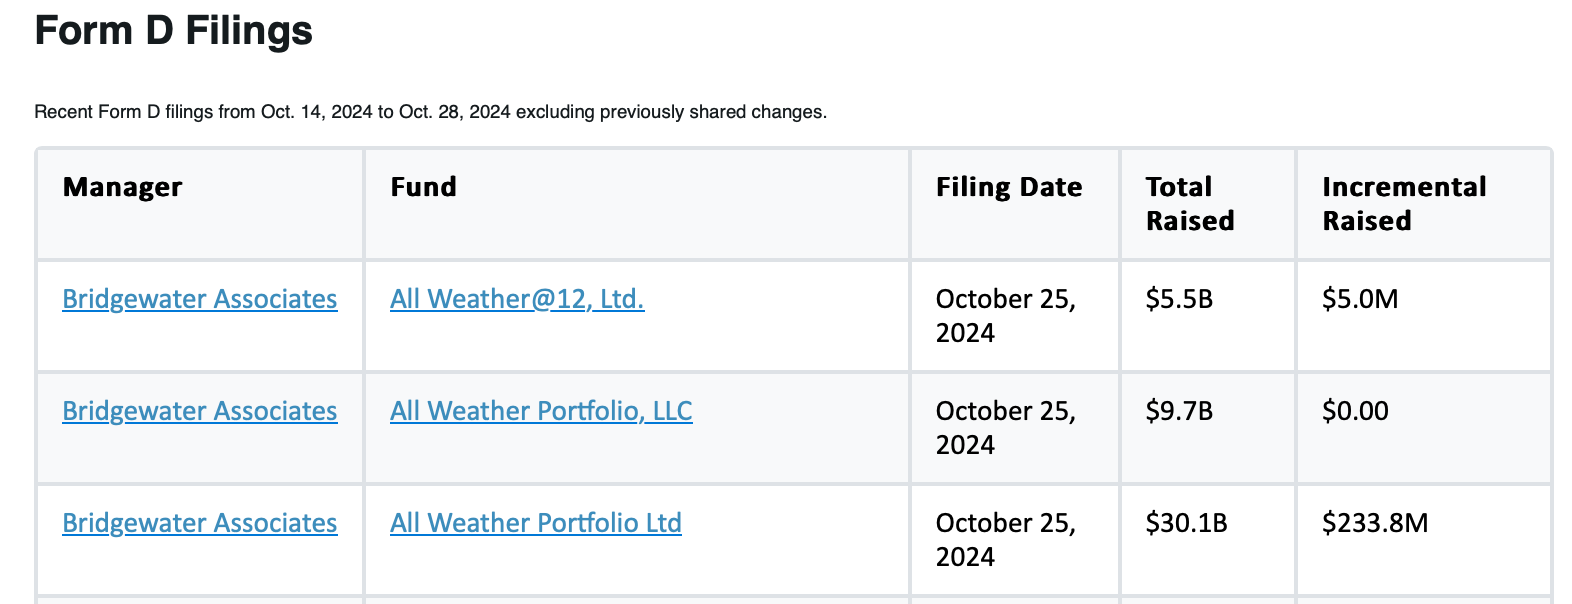
Searching for filings on the Form D feed is now faster and more informative, thanks to the addition of new filtering options and a column showing the incremental capital raised by the fund.
We’ve expanded our public pension dataset, adding 24,097 manager investments across approximately 230 public pensions. New pension profile pages now feature:
- Asset Allocation Details
- Performance Metrics
- Historical Assets Under Management (AUM)
- Complete Holdings Data
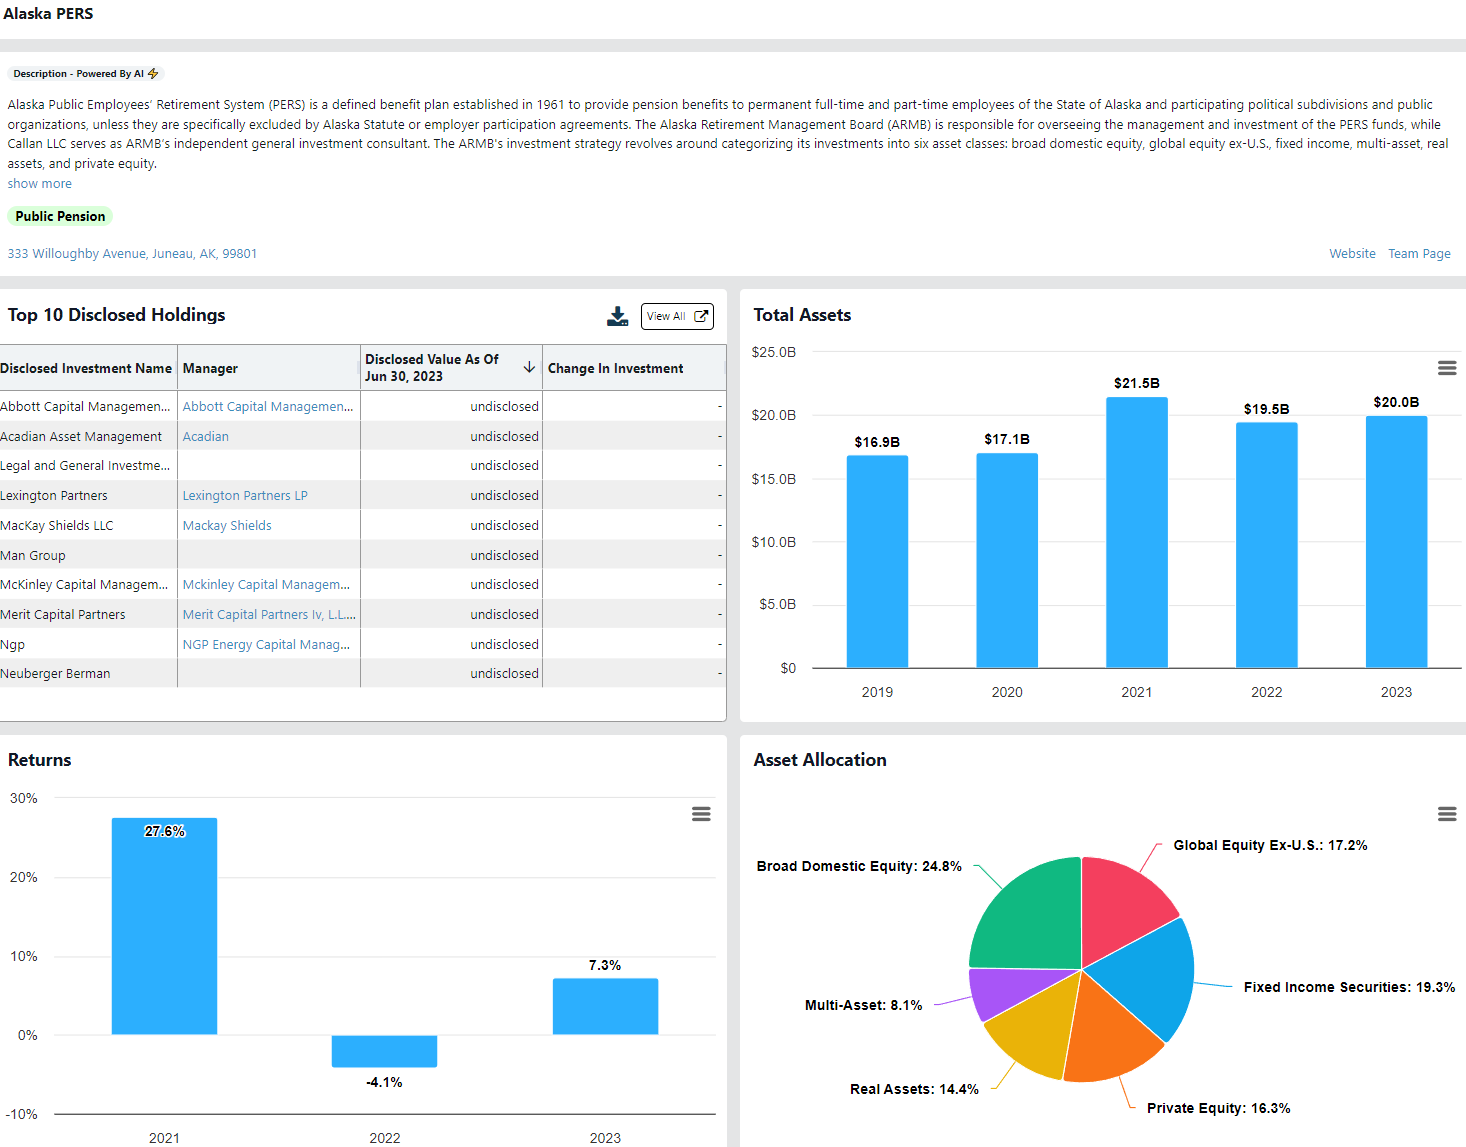
At OWL, we have always prided ourselves on having the best data on endowment and foundations, and are excited to continue to build out our pension data.
We upgraded our process to update ADV data, improving the speed at which OWL will collect new launch information and other one-off updates that sometimes occur during the year.
We simplified the layout of the info cards, which are on the top of each manager and allocator profile page. We removed redundant information, and tags are now displayed below descriptions. Stay tuned in future months for improvements to our manager tags!
September 2024
In September, we launched email alerts, expanded our people data, and improved search and several other features across the platform.
We're thrilled to announce the launch of our email alert system. We have billions of data points about managers and allocators in OWL, and email alerts substantially improve the OWL experience by providing proactive updates about events our users care about. Alerts currently include team changes and public equity transactions detected in our global ownership database. Future alerts will include business updates (from Form Ds and ADVs), allocator disclosures, relevant news/articles, and more.
Alerts will begin to go out broadly this week. Users are encouraged to create a "My Portfolio" to start receiving these alerts for the managers on your custom lists. If you have any questions on how to do that, please reach out!
Create a Portfolio Here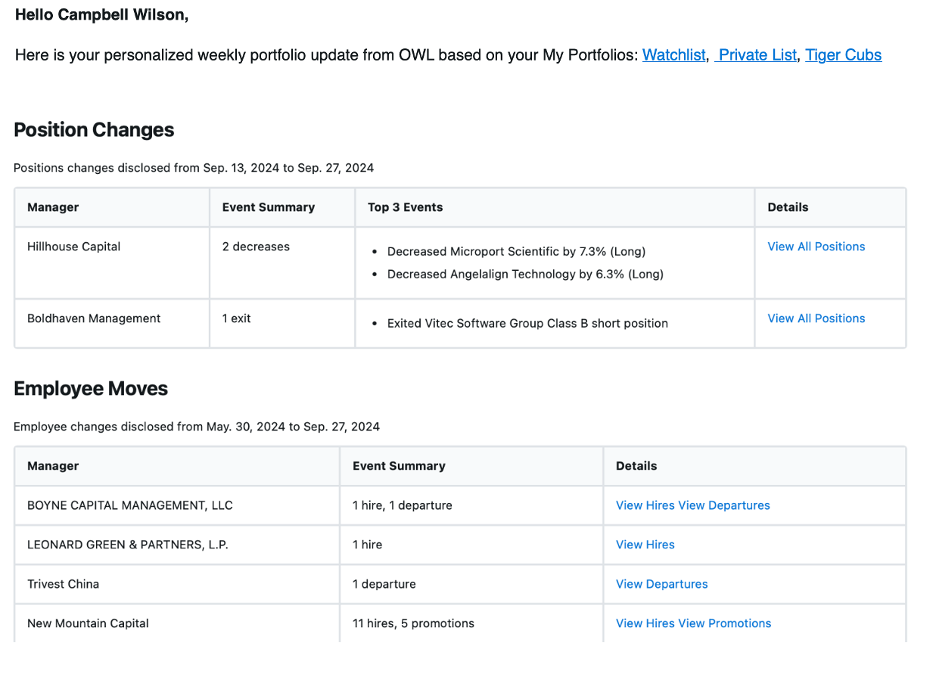
Our people database has grown significantly and now tracks over 1 million current and former employees at investment managers! On the back end, we have a new process that will enable us to keep our data up-to-date and continue to add new people quickly and easily. Some quick stats on our current data:
- Over 1 million individual profiles with more than 1.7 million unique email addresses
- 10,538 managers with updated people data
- Over 6 million work experiences recorded
The additional data and improved processes will allow for more comprehensive tracking of team movements and industry trends across teams.
We made several improvements to the site’s organization and search functionality to enable users to find and share information more efficiently.
On OWL’s allocator profiles, we added tags for allocator types, such as Endowments, Foundations, etc. Clicking on a tag will create a filtered list of allocators of that type.
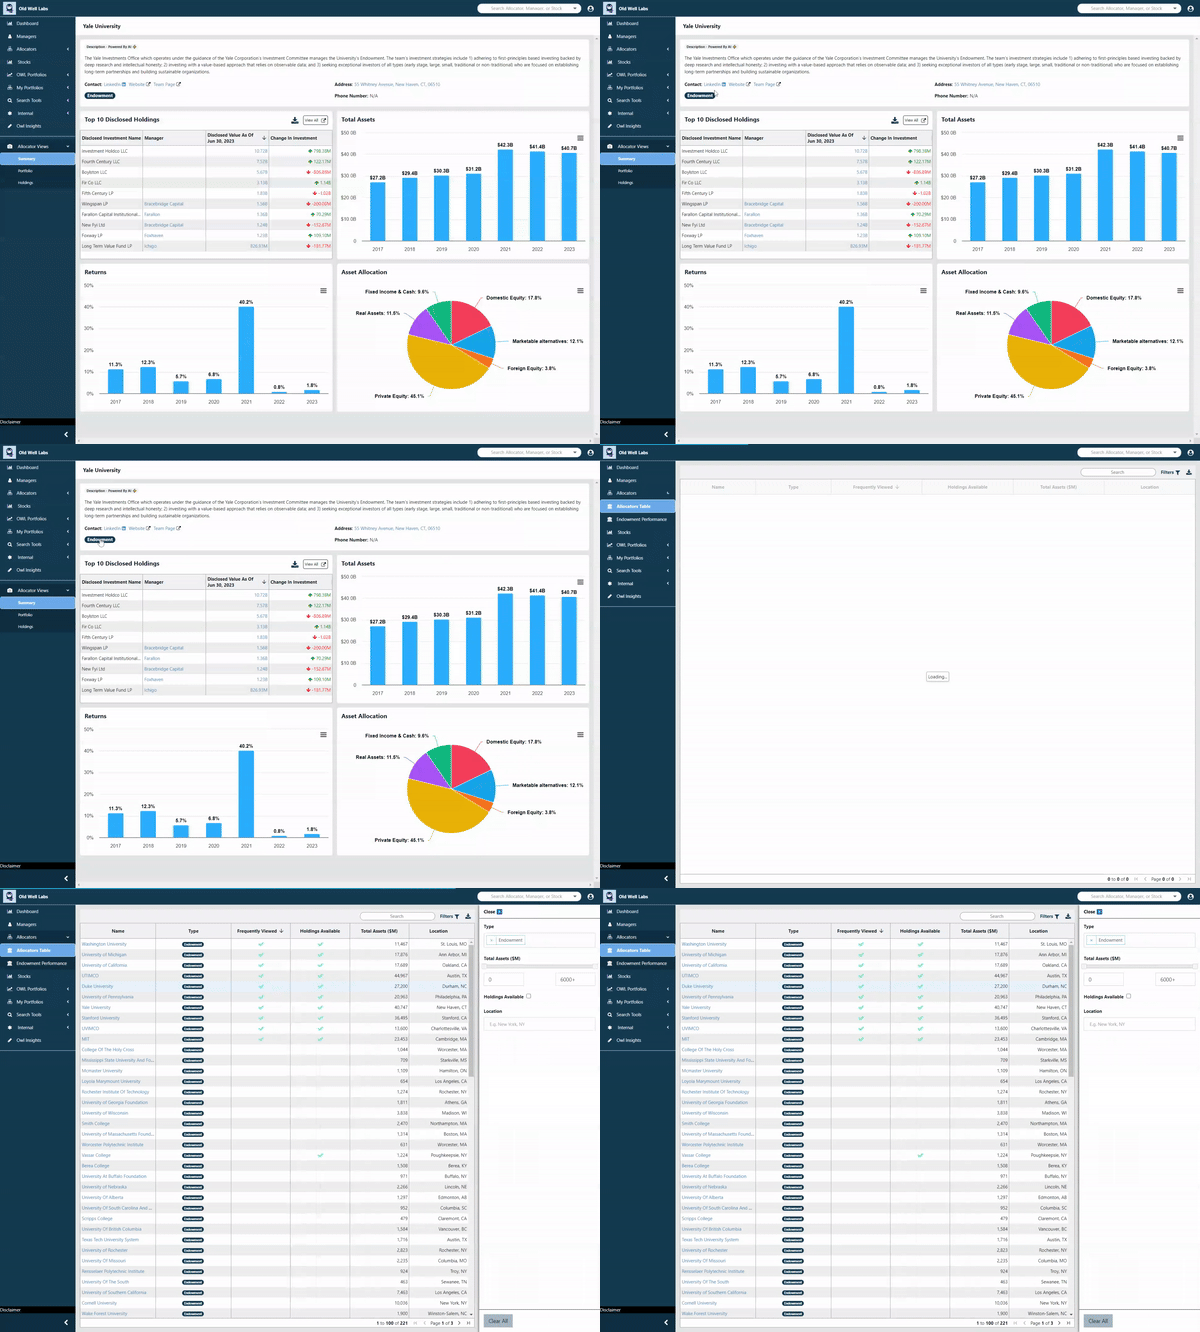
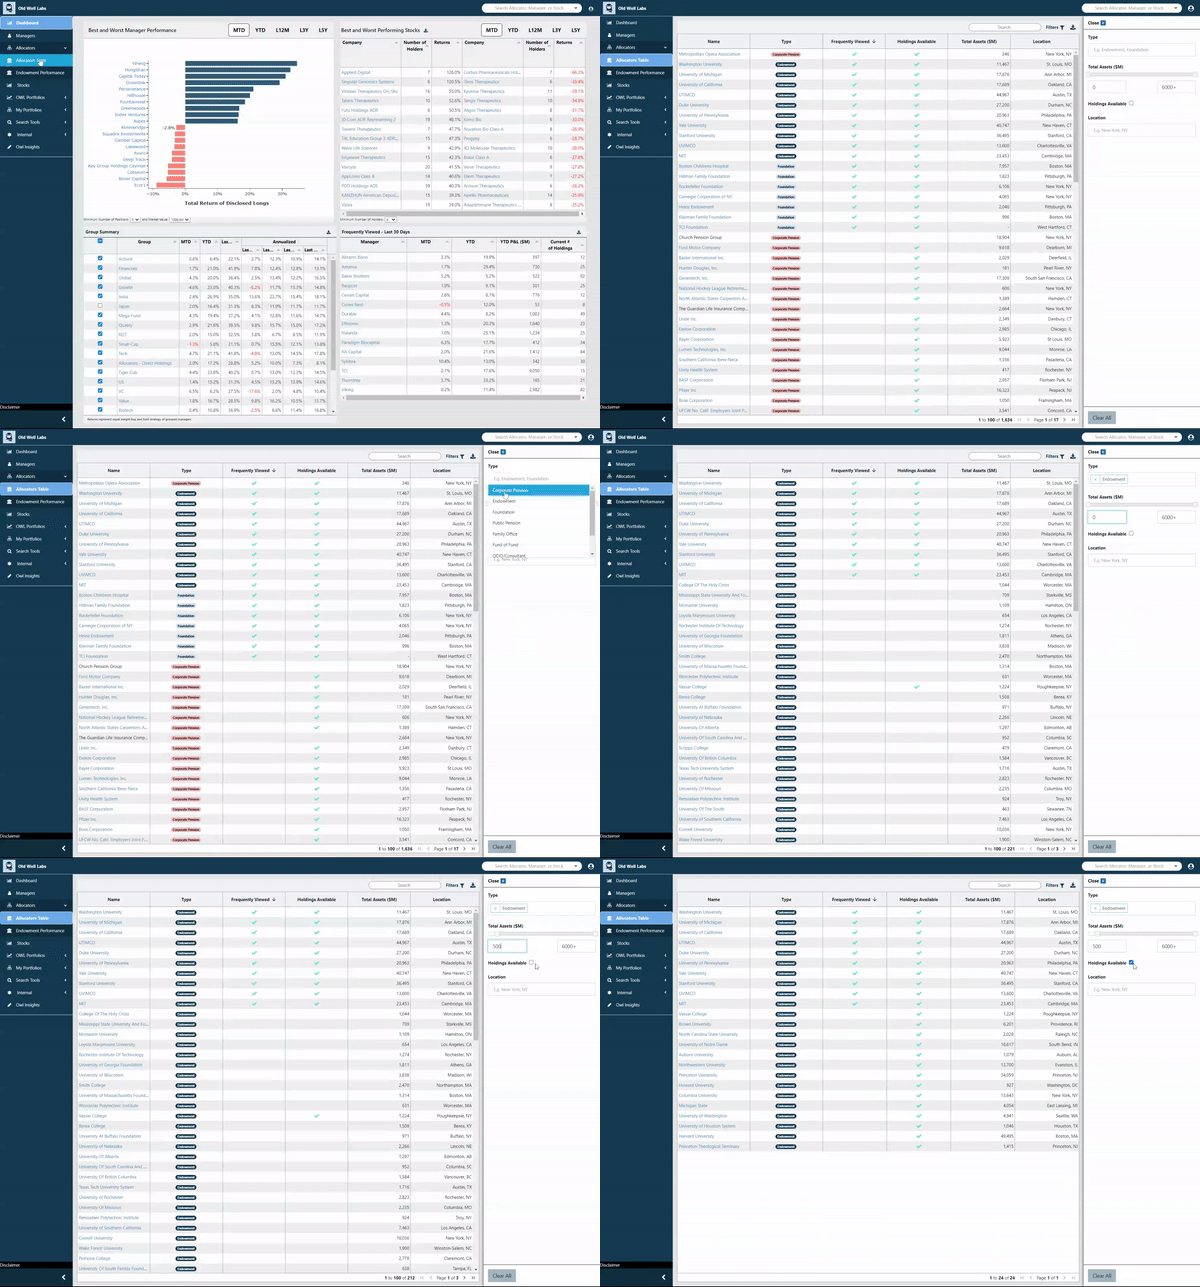
We also added additional ways to filter our database of allocators, which includes over 2,000 allocator profiles today. OWL users can now easily filter based on type of allocator, size, location, and holdings availability. For example, a user can quickly search for endowments with more than $500 million in assets and holdings that are available in OWL:
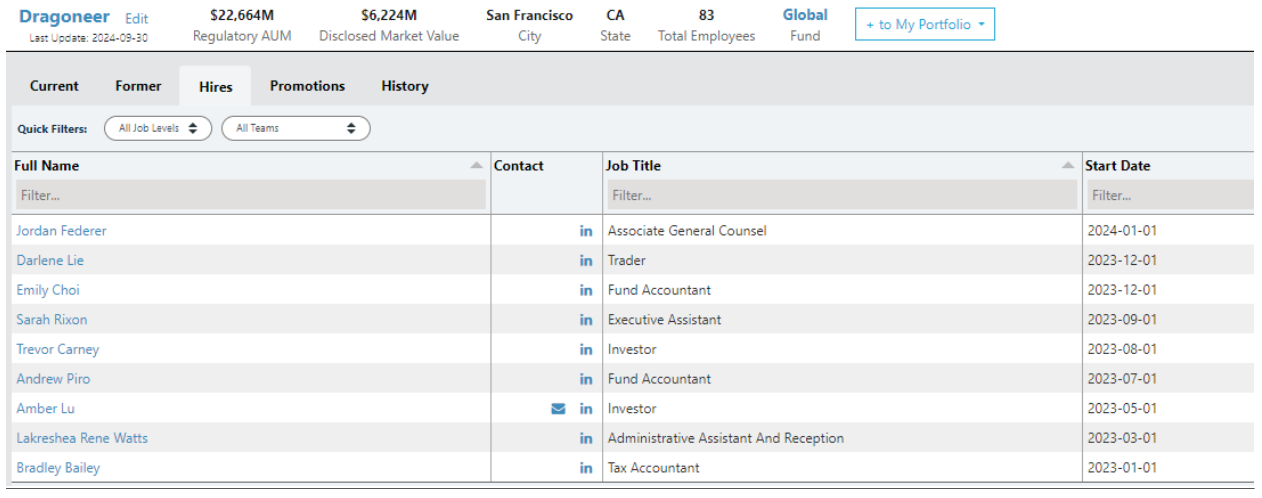
Several sections in a manager’s profile include multiple tabs of data. We improved the structure of the site so that users can now share a specific tab with colleagues via a unique URL, rather than the whole page. As an example, users could share a link for the “Hires” tab below. We plan to add additional sharing features in the coming months, including the ability for colleagues to share directly in the platform.
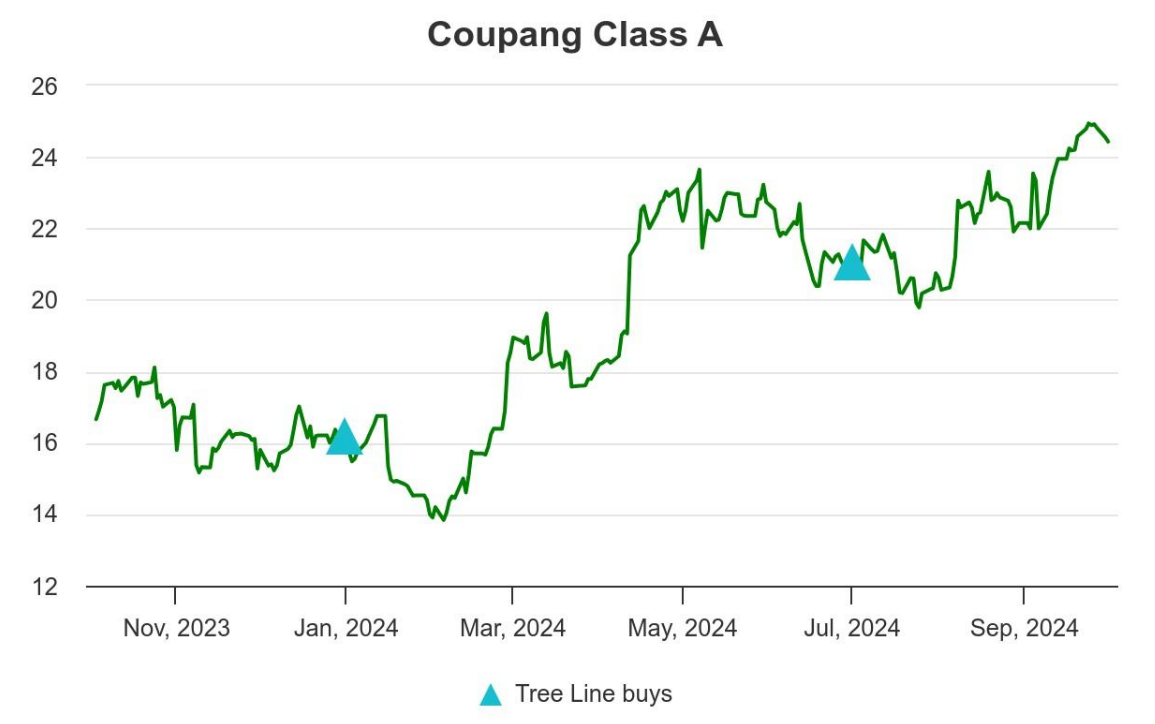
We continue to improve download capability across the site. This month, we improved our stock chart downloads, updating the formatting and adding the security name to the download:
We're excited about several features in development:
- Expanded email alerts, including Form D data, which will highlight new capital raised by a manager.
- Improved search functionality, including additional filters and tags for managers and allocators.
- Continued improvements to data timeliness and coverage, adding some new data sources (more to come in future updates!)
August 2024
In August, we focused on expanding the depth of our data with the addition of Form D filings, improving our soon-to-be-released email alert system, and refining our search functionality. Below, you’ll find detailed information on these enhancements, along with links to explore the new features directly within your OWL dashboard.
In our quest to capture all publicly available data about managers, we’ve added Form D data to OWL. As a reminder, companies and managers must file a Form D with the SEC when they sell unregistered securities, including when a manager raises capital for a fund. This is a massive data set – we currently have nearly 650,000 filings going back to 2008.
With this data we’ve enabled two initial views:
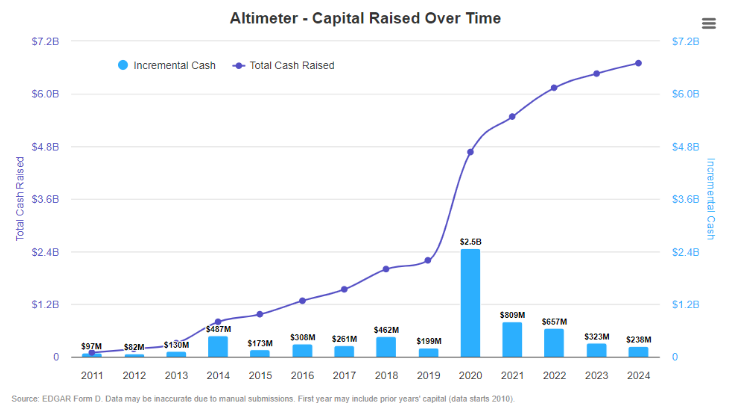
- You can now see how much capital a manager has raised YoY on the “Capital Raised” tab in the Funds section of the manager profile. Note that the annual numbers are estimates for each specific year – the filings in each year represent capital raised in the last 12 months, which may include part of the prior year. This is also gross capital raised and does not account for any redemptions.
- You can also search all Form D filings from the past 90 days using the Form D Feed, located on the main lefthand sidebar. For instance, you can see recent hedge fund launches that have raised capital, including amount raised and minimum investment required:
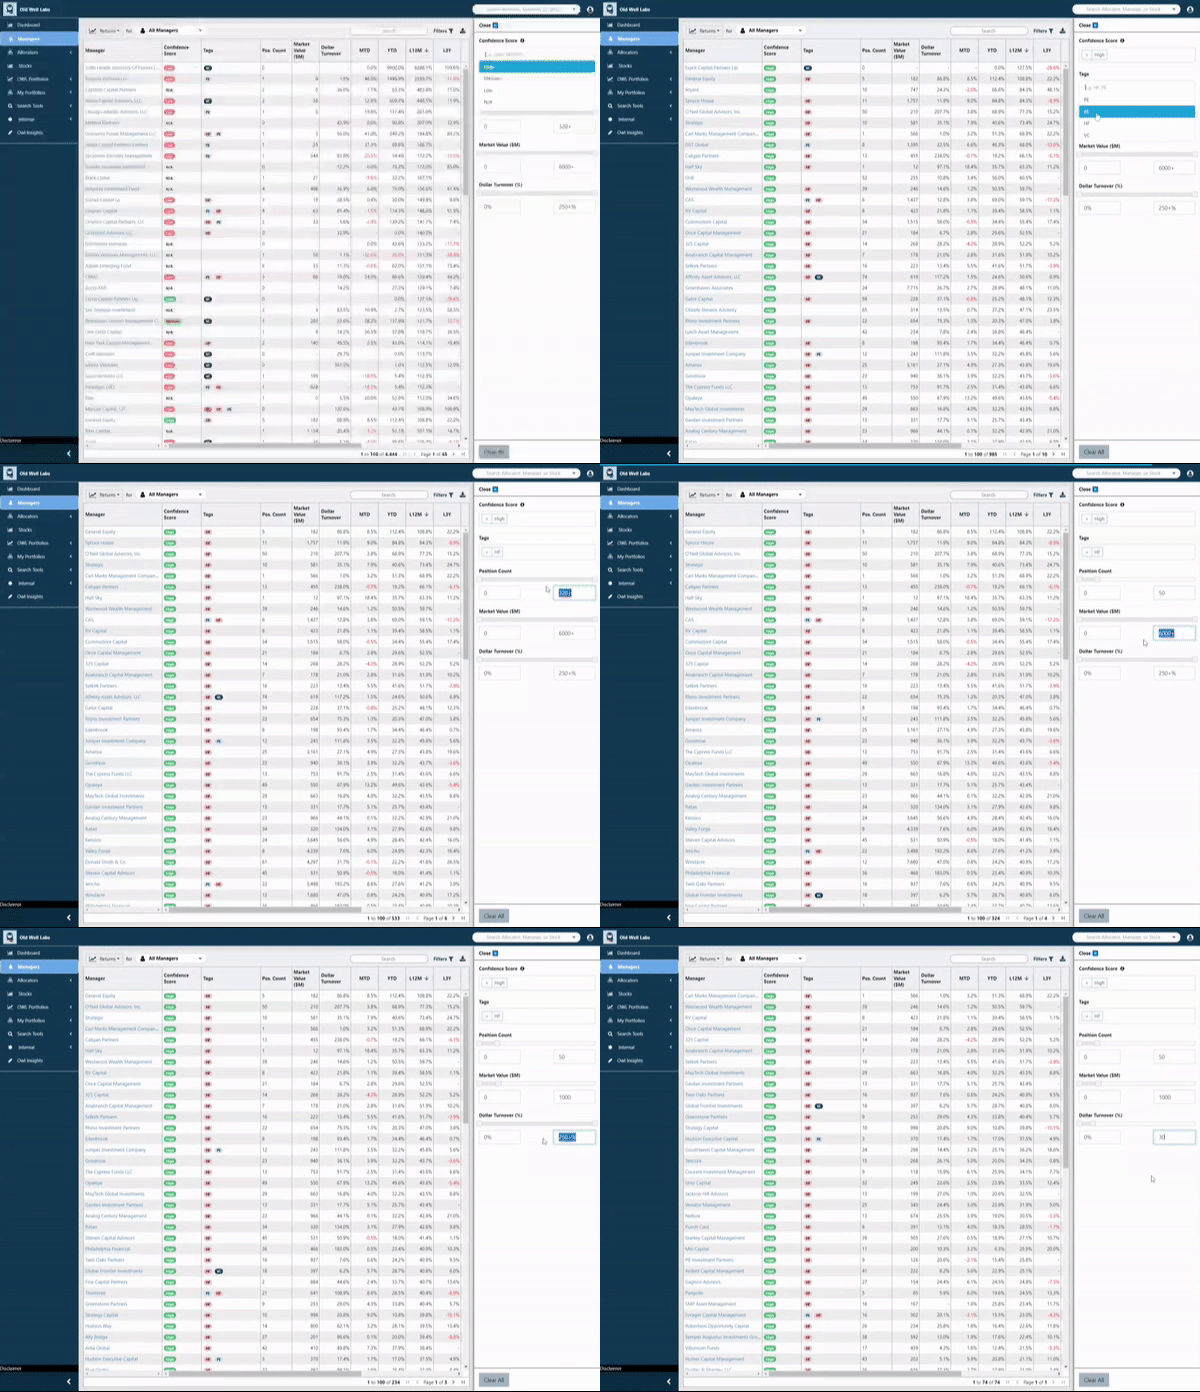
Form Ds are a really exciting new data set for us, and we expect to add more features using this data throughout the year. Form Ds are often the first public disclosure for a new manager (even before a 13F or ADV) – a great source for allocators to find new managers before they are well-known. More features for that use case coming soon!
Based on feedback from our customers, we are focused on launching email alerts in the coming weeks. For users that have set up custom portfolios of managers, these alerts will give you timely information about changes in your managers’ positions and estimated performance, as well as team changes at the firms. We recently launched emails internally for testing, and expect to beta launch this feature soon to any of our existing customers who would also like to receive alerts. Let us know if you would like to be included in our beta test – we’d be happy to include you if you can give us feedback along the way!

As we move towards a more unified and comprehensive search experience, we've moved filters and search functionality to a sidebar on the main Manager table, rather than having search as a separate page. On the manager table, the sidebar now enables users to filter for factors like confidence score, type of fund, position count, and market value.
View the Manager Search Here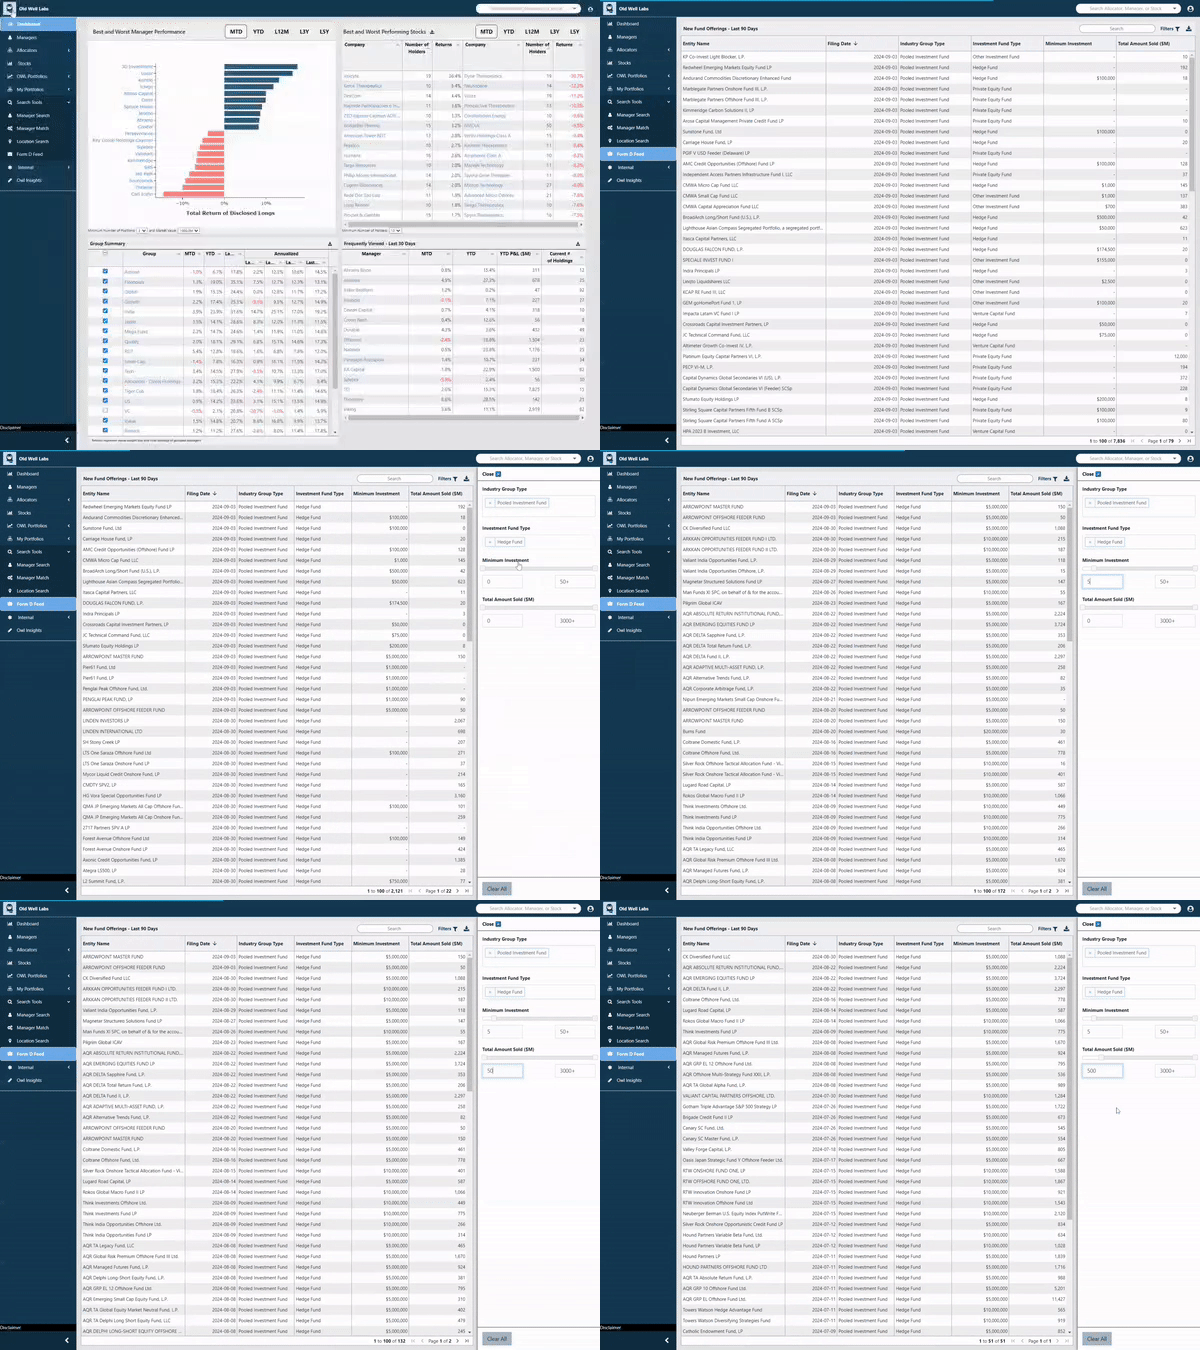
These filters are just the beginning - we plan to continue to build out this search functionality with more data and filter options in the coming months.
At the manager level, we broke out the views to make it easier to see team movements at the firm level. We now have Former Employees, Hires, and Promotions are all separate tables.

Similarly, for a custom portfolio of managers under My Portfolios, we now show separate tables for Departures, Hires, and Promotions. This will make it easier to quickly identify meaningful team changes across a portfolio of managers.

- We recently updated the Manager Navigation views on the left side to provide easier access to the pages our users like to visit most often. For each manager, you will now find Allocator and Employee views closer to the top.
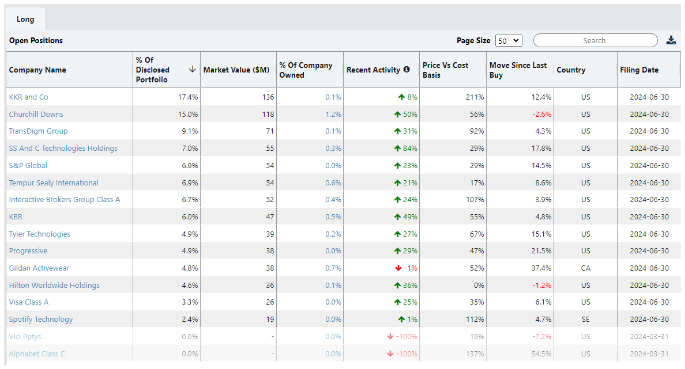
- On manager holdings pages, closed positions are now greyed out at the bottom, making them easier to identify:
Many of these improvements in August were a response to feedback from our users. Please keep sharing your ideas and pain points, and we will continue to incorporate them into our product roadmap!
July 2024
We continued enriching OWL’s universe of managers and allocator holdings. In July we increased the total number of managers in the OWL system to 10,500 across all asset classes. We also added 1,779 allocator holdings (e.g., manager investments), bringing the total to 34,000 allocator holdings with over 30,000 mappings to an OWL manager.
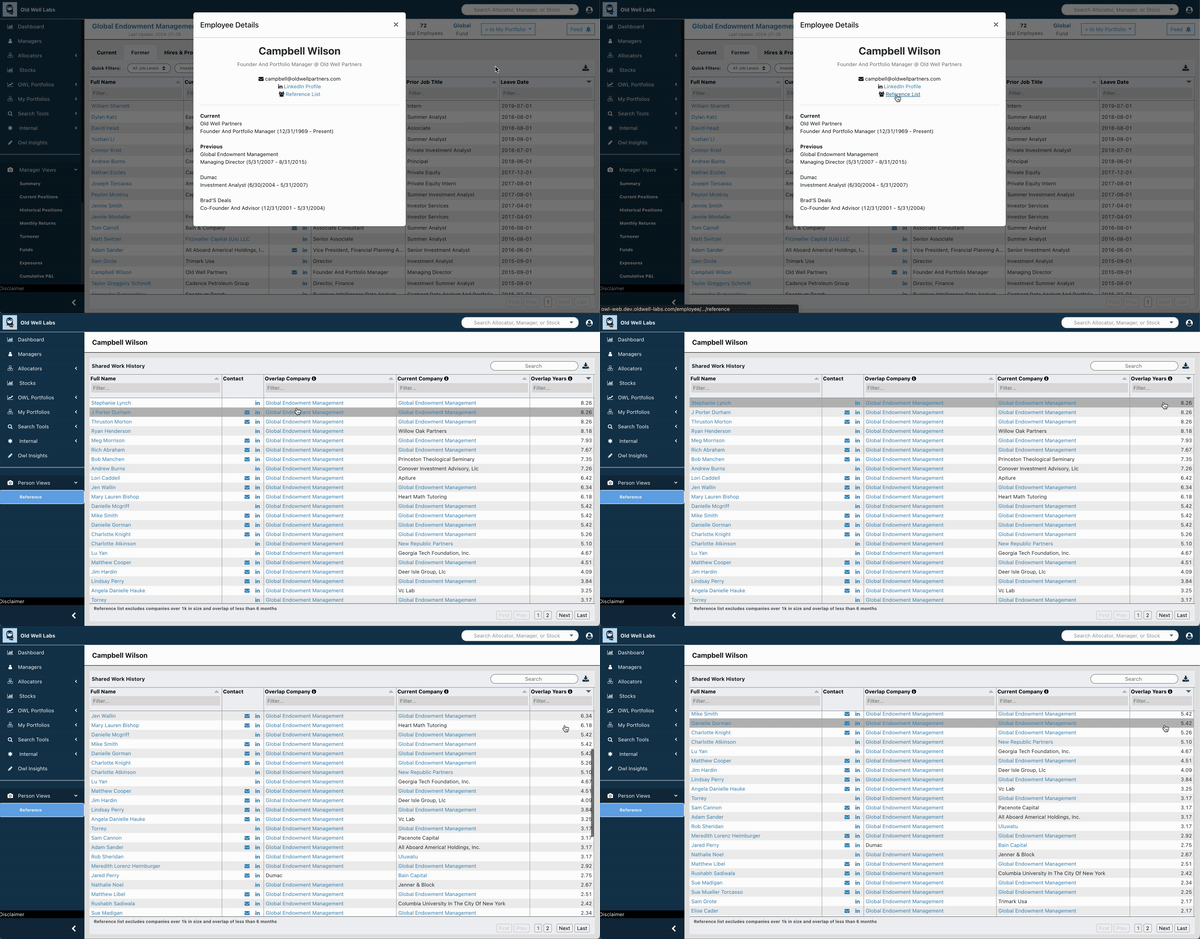
We’re excited to announce that employee cards now have a link to a one-click reference list, allowing users to quickly tee up references and avoid laborious LinkedIn searches:
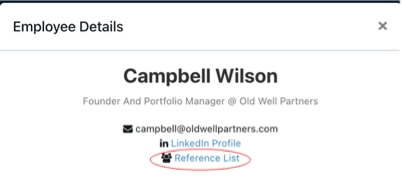
Clicking this link will take you to a table that displays any shared work history between that person and nearly 1 million other individuals in OWL's people database:
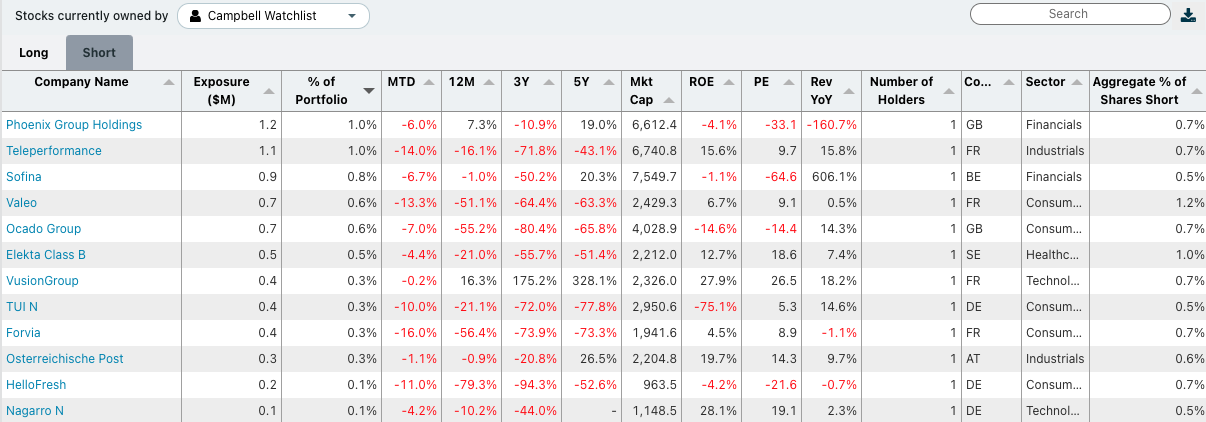
Last month, we added shorts to the ‘Manager’ and ‘Security’ views in OWL. This month, we also added shorts to the ‘My Portfolios’ view. Users can now see disclosed short holdings across a custom portfolio of managers they track in OWL. OWL users can set up an unlimited number of custom portfolios in the platform in order to track aggregated returns and exposures across those groups:
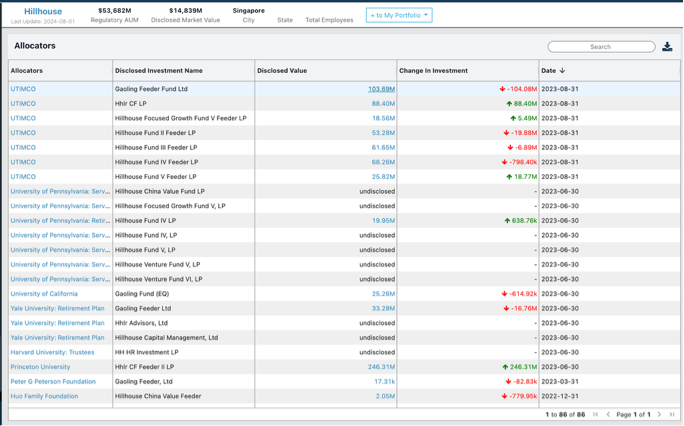
We updated the ‘Allocators’ view under a manager’s profile to make it easier to see which specific vehicle allocators are invested in with that manager:
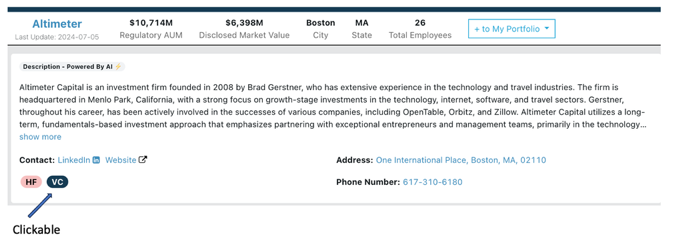
Tags for a manager’s fund type are now clickable. Clicking the tags for a manager’s fund type now redirects to a filtered list of all managers that share a similar tagging. We are actively working on rolling out additional tagging, which should further enhance the search process across the platform.
Once you create a custom search using manager tags, you can now add or remove tags for more specific filtering directly from the populated list of managers. We will continue adding more ways to search & filter for managers in the coming months.
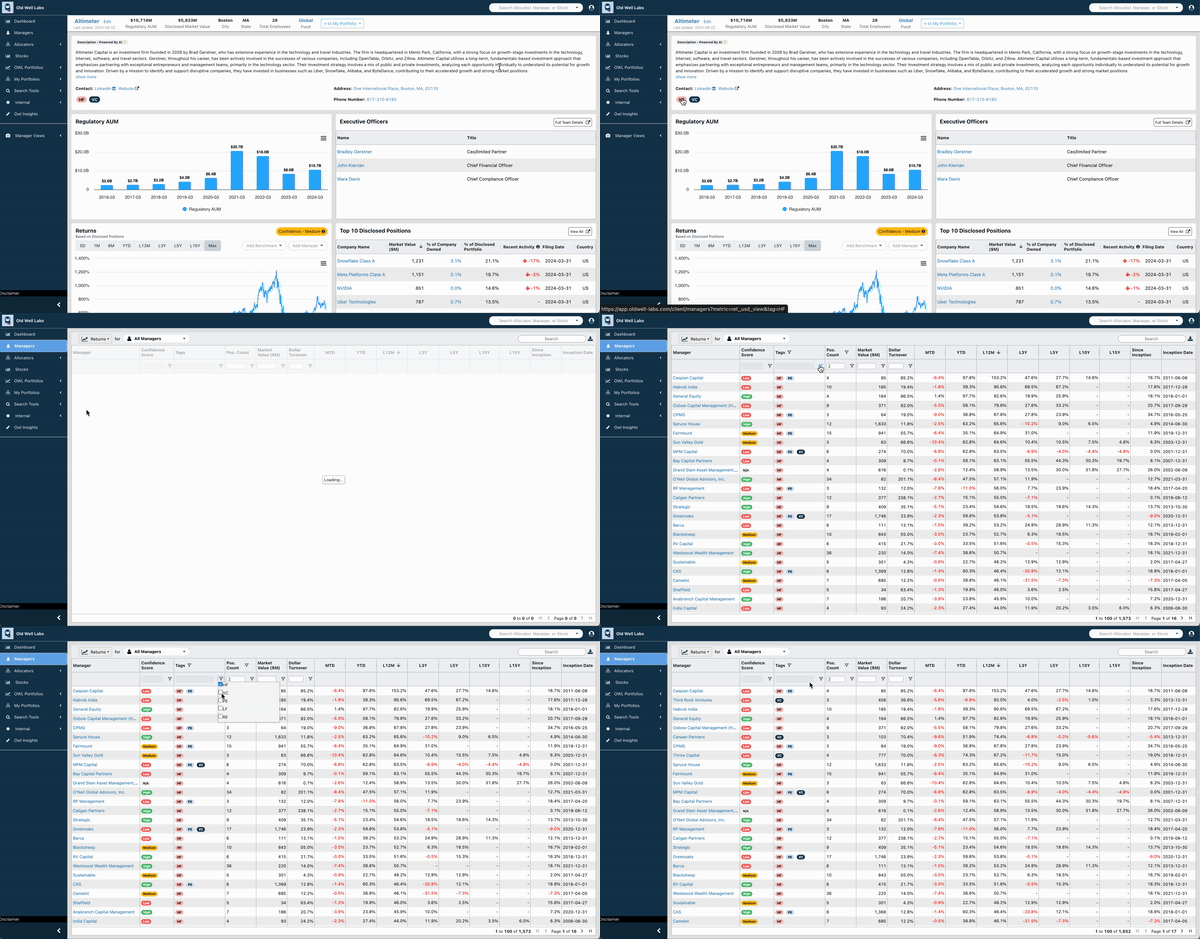
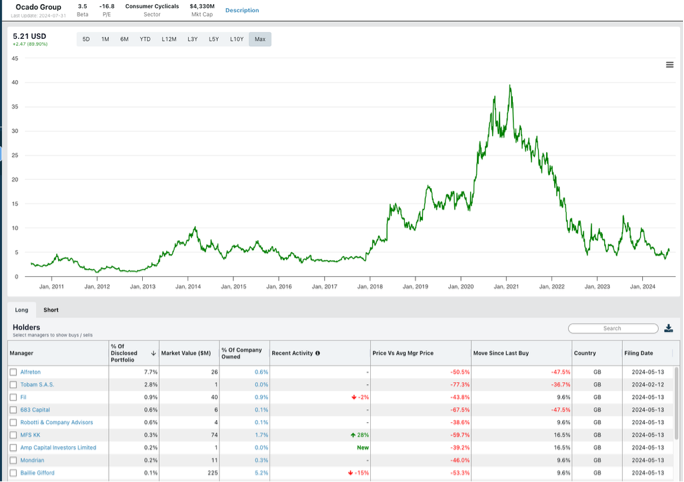
We updated the formatting for the stock-level homepages to make them more user-friendly. The improvements include new download options, including plotted buys/sells by the selected managers, and a more mobile-friendly view:
Many of these smaller improvements, in addition to the larger feature releases, were based on user feedback and suggestions. Please keep sharing your ideas and pain points, and we will continue to incorporate them into our product roadmap!
June 2024
In June, we focused on enhancing our allocator data and tagging. 79% of our allocator holdings are now mapped to a manager in our system, up from about 30% a year ago. We expect this to continue to increase as we add more managers to the system that are already tagged in our data. In addition, 31% of the managers in OWL now have a disclosed investment from an allocator. We expect that number to increase as we continue to build our allocator database.
We also added 1,618 managers to the platform in June, bringing the total number of managers to 10,109 as of month end.
A big priority for June was updating and enhancing our allocator profile pages. In addition to basic information (AUM, location) and holdings when available, allocator profiles now include a description, website, LinkedIn pages, etc., similar to our manager profiles. The release at the end of June was our first iteration, and we expect these profiles to continue to improve over time as we pull in more data.
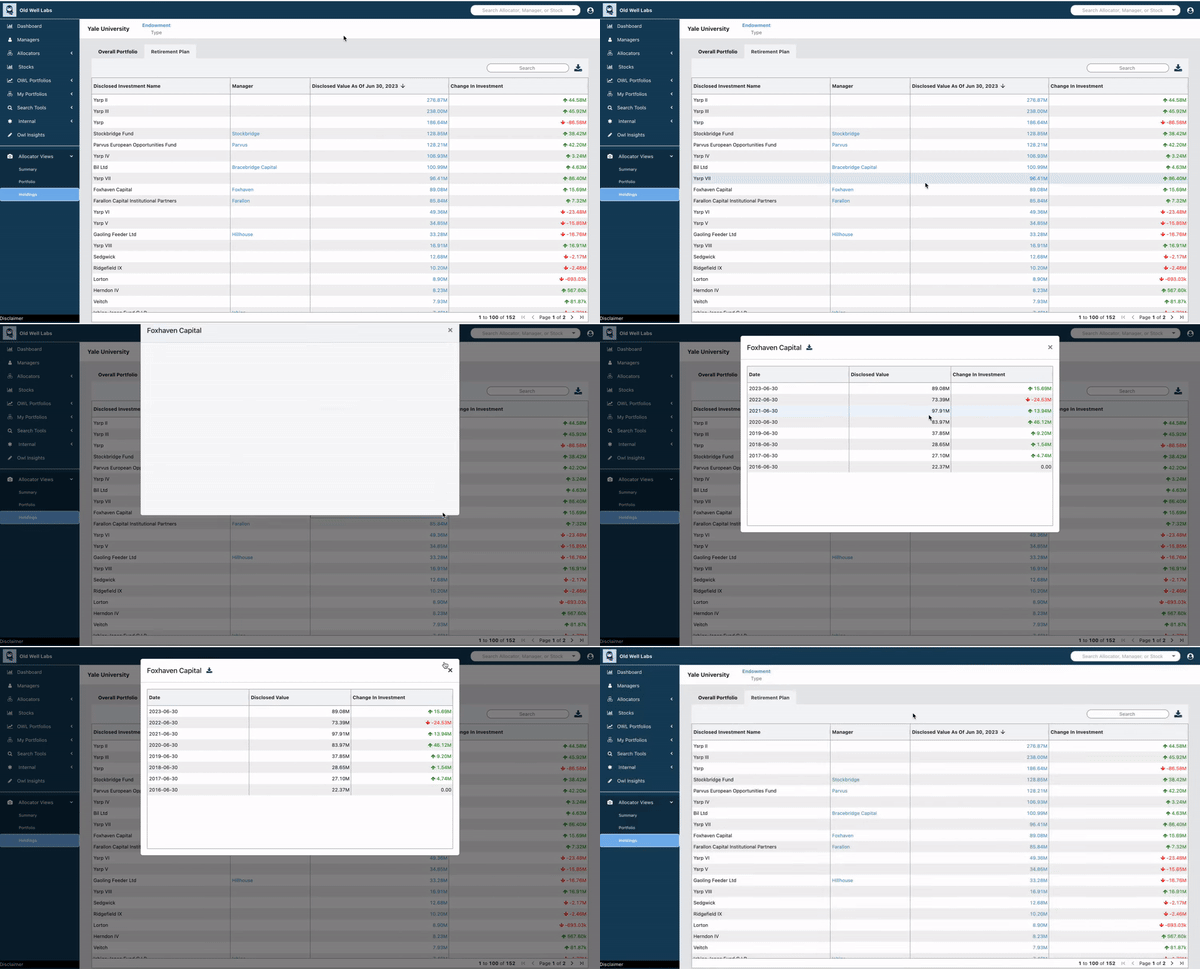
On allocator holdings pages, users are now able to see beyond the two years of history that we previously showed. For any investment into a manager, you can click on the current investment amount and see the history of changes going back several years.
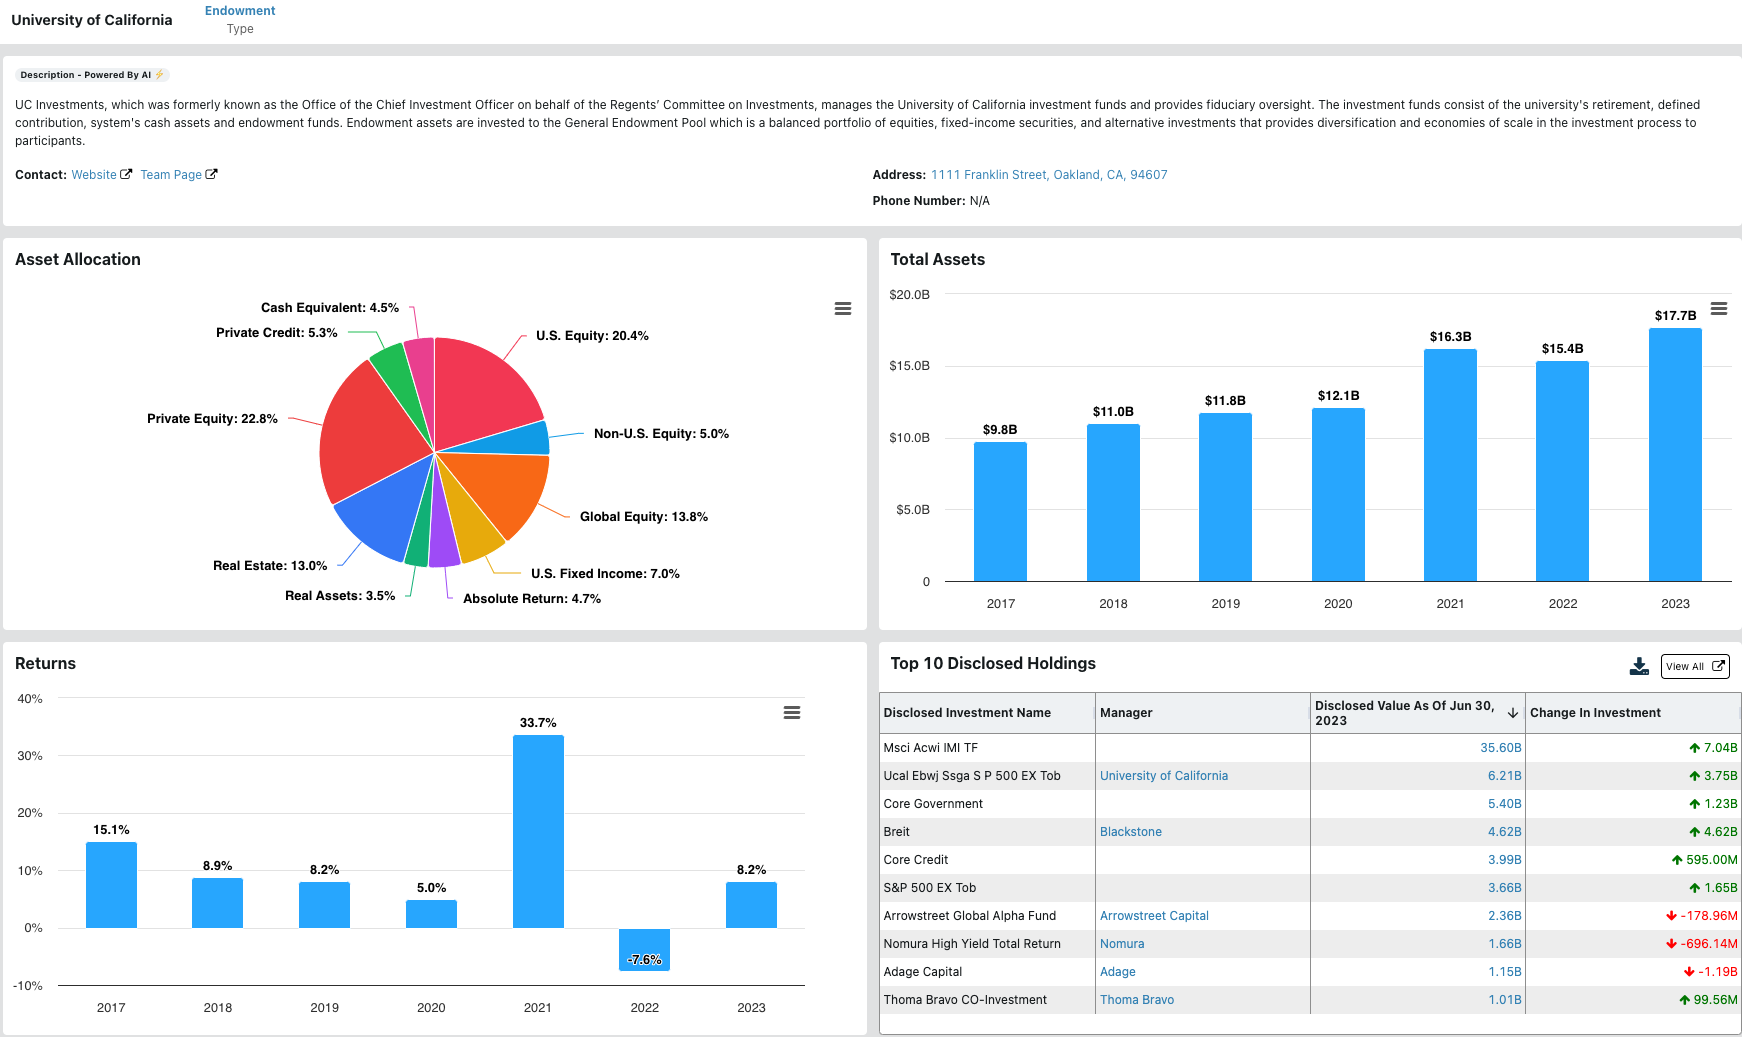
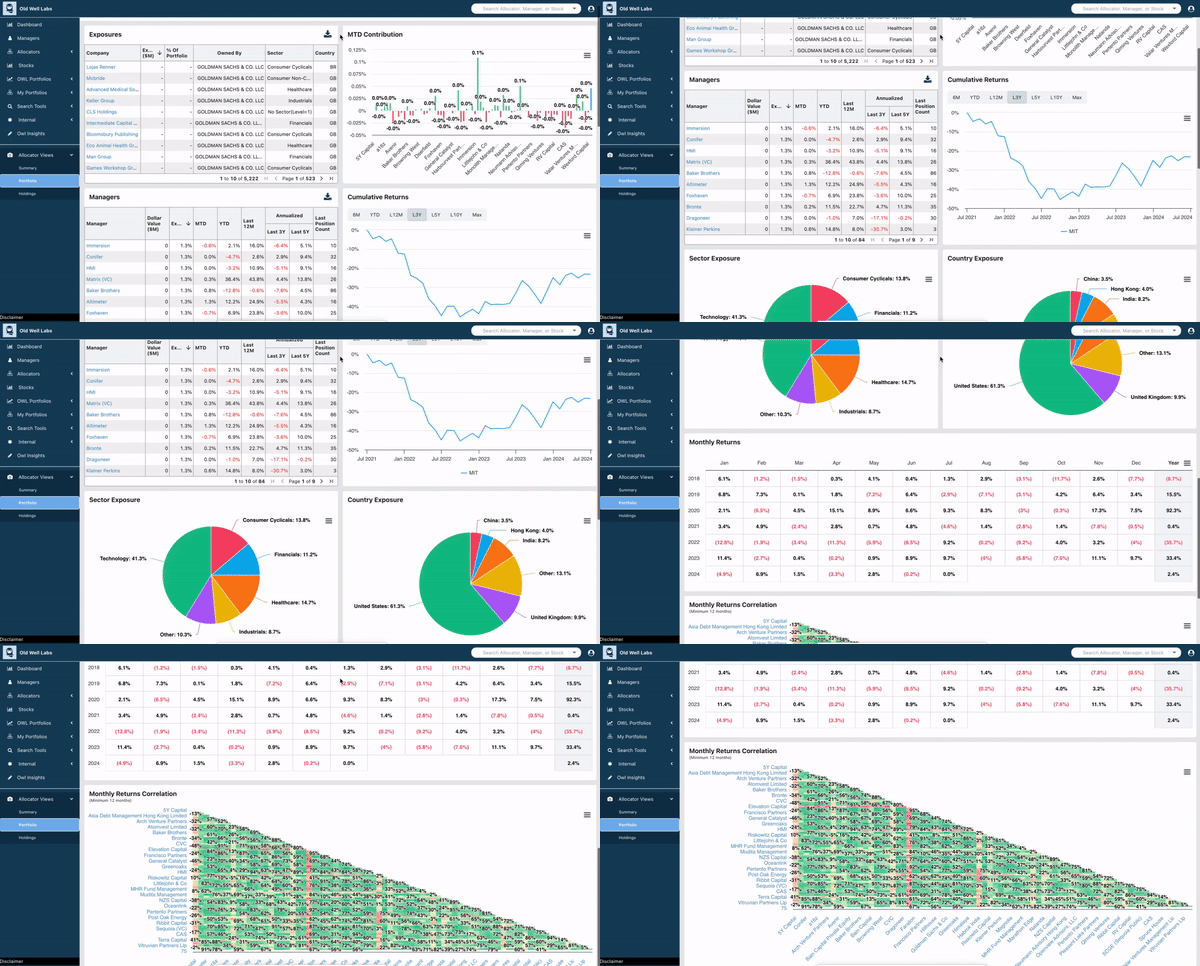
For allocators with holdings and mappings to OWL managers, we’ve added a portfolio view that shows an equal-weighted view of the portfolio, including performance and exposures across the portfolio:
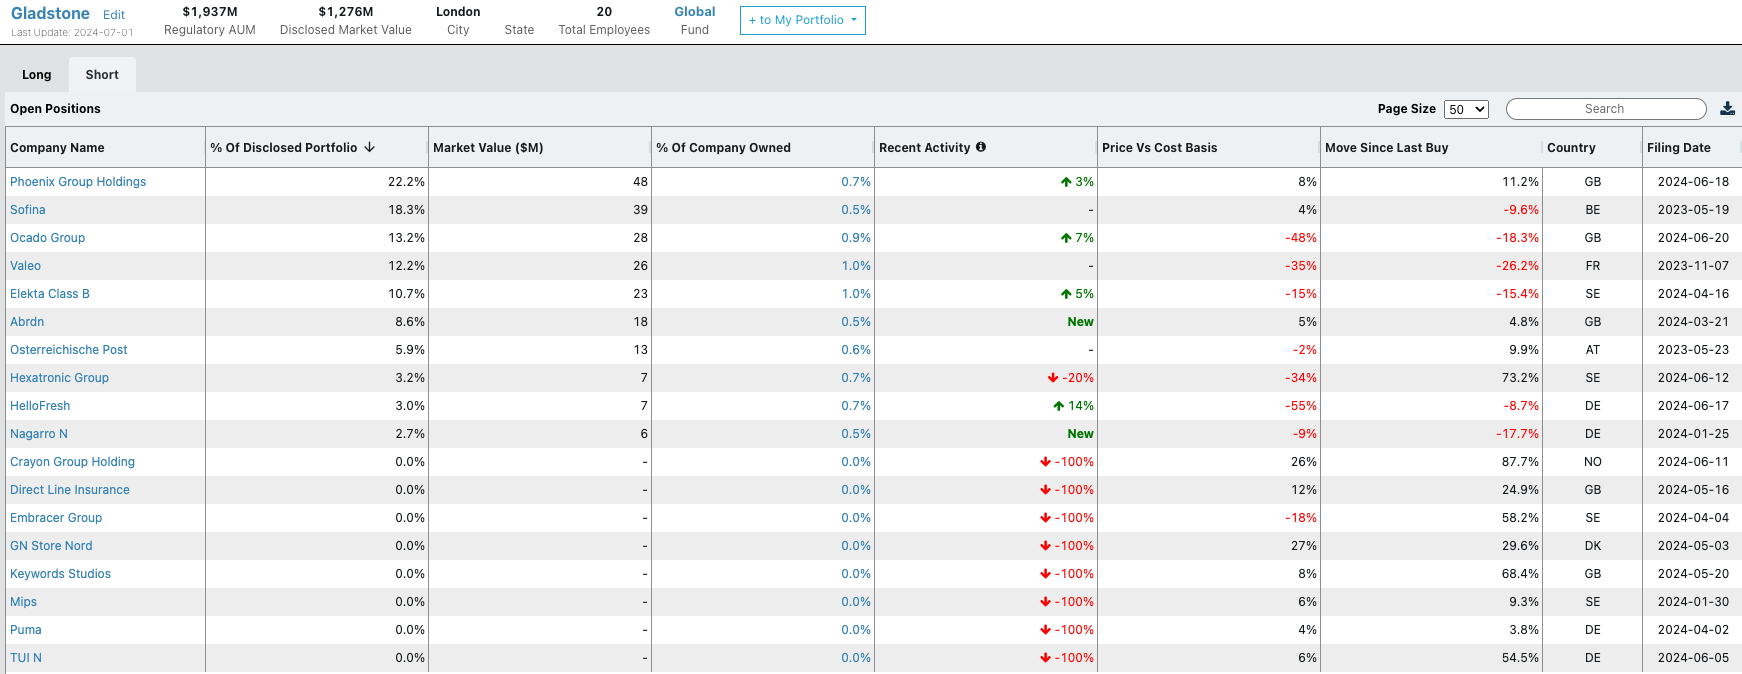
Shorts, especially in Europe, are some of the highest quality filings in the world. In June, we added in the ability to see a manager’s disclosed short positions on their portfolio pages by clicking on the “Short” tab:
For any given stock, users can now also see the managers that are short by selecting the “Short” tab as well:
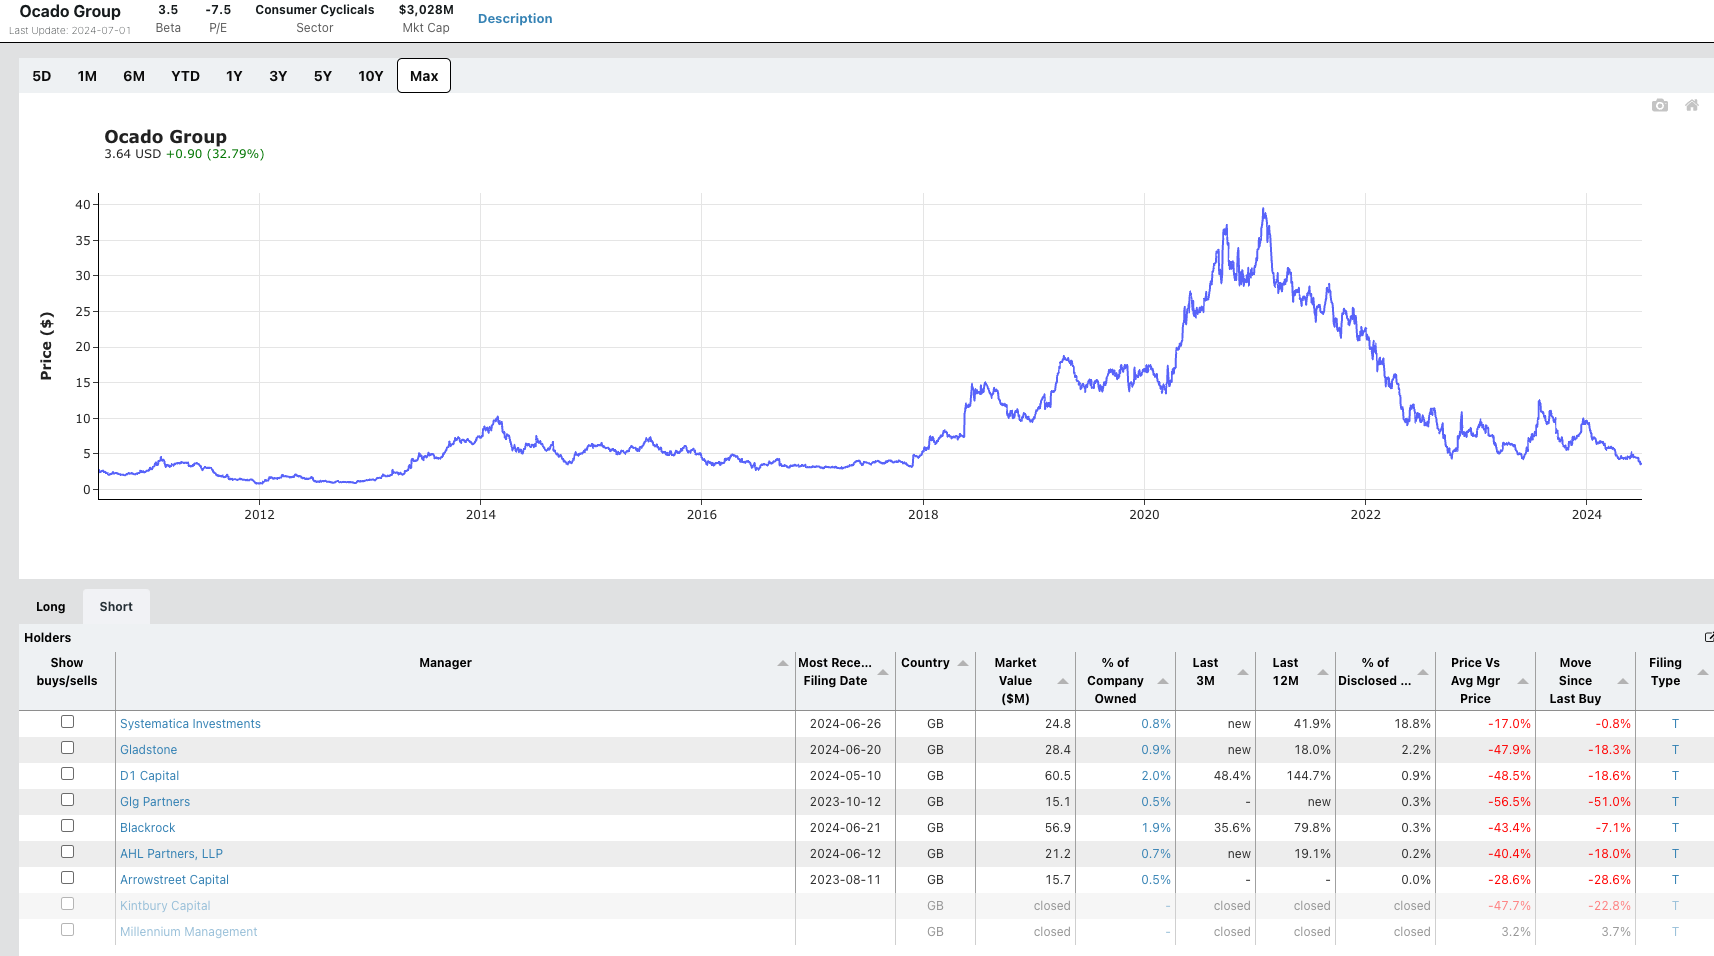
We think knowing what stocks a manager is short is an incredibly valuable data point when doing diligence, and we expect to further integrate this information into the OWL platform over time. As a reminder, all returns shown in OWL are still the returns of the manager’s publicly disclosed long positions.
To help in manager search and discovery, we’ve added several filters to the main manager scorecard. Users can now filter for data points like confidence score, position count, and market value when searching for managers. As a reminder, we added the confidence scores in April based on user feedback, to help users understand how close OWL’s estimate returns might be to the manager’s actual returns:

In June, we also improved a number of features in OWL to be more user-friendly. A couple of examples of that include faster loading times for the location search (especially in very popular places like New York City) and the historical shares view. We also updated the site’s search functionality to make it easier to find a given manager, allocator, or stock using the first few letters of the name. On the historical shares view, we also added the ability to search within the positions to more easily isolate a given stock. Many of these smaller improvements, in addition to the larger feature releases, were based on user feedback and suggestions. Please keep sharing your ideas and pain points and we will continue to build those ideas into our product roadmap!
May 2024
During May, we added 1,170 managers, bringing the total number of managers in OWL to ~8,500. With those managers came 300,000 new public equity positions. We also updated our ADV data to include Q1 data. Managers are required to file their annual ADV by 3/31, so this was a significant data update, highlighting how managers’ businesses have changed over the past year.
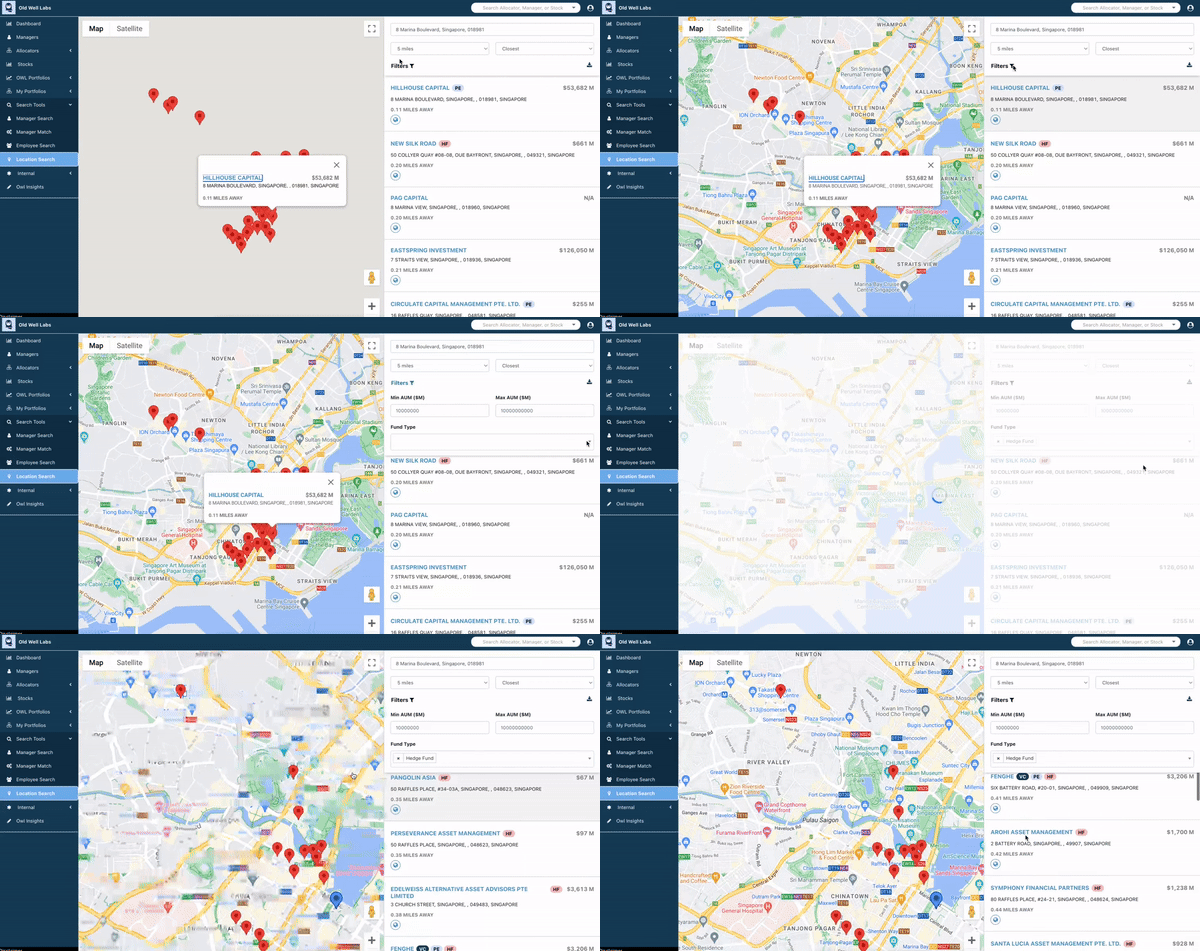
Our location search feature that we launched in March now includes the option to filter by manager type (hedge fund, venture capital, etc.). We will continue to add additional tags and filters here in the coming months to enable users to further refine their search results to what is most relevant for them.
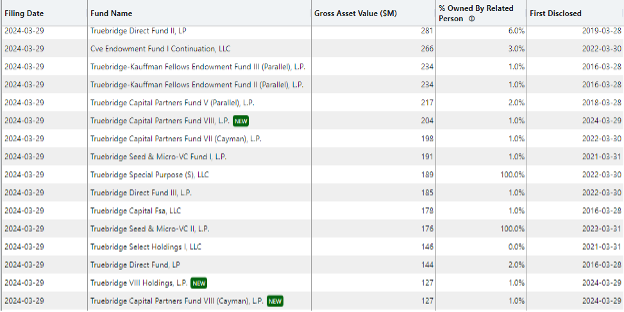
On the list of funds disclosed by each manager, we added “NEW” tags to make it easier to identify which funds are new in the manager’s most recent filing. In addition, we added a column to note the first time a fund appeared in a manager’s ADV.
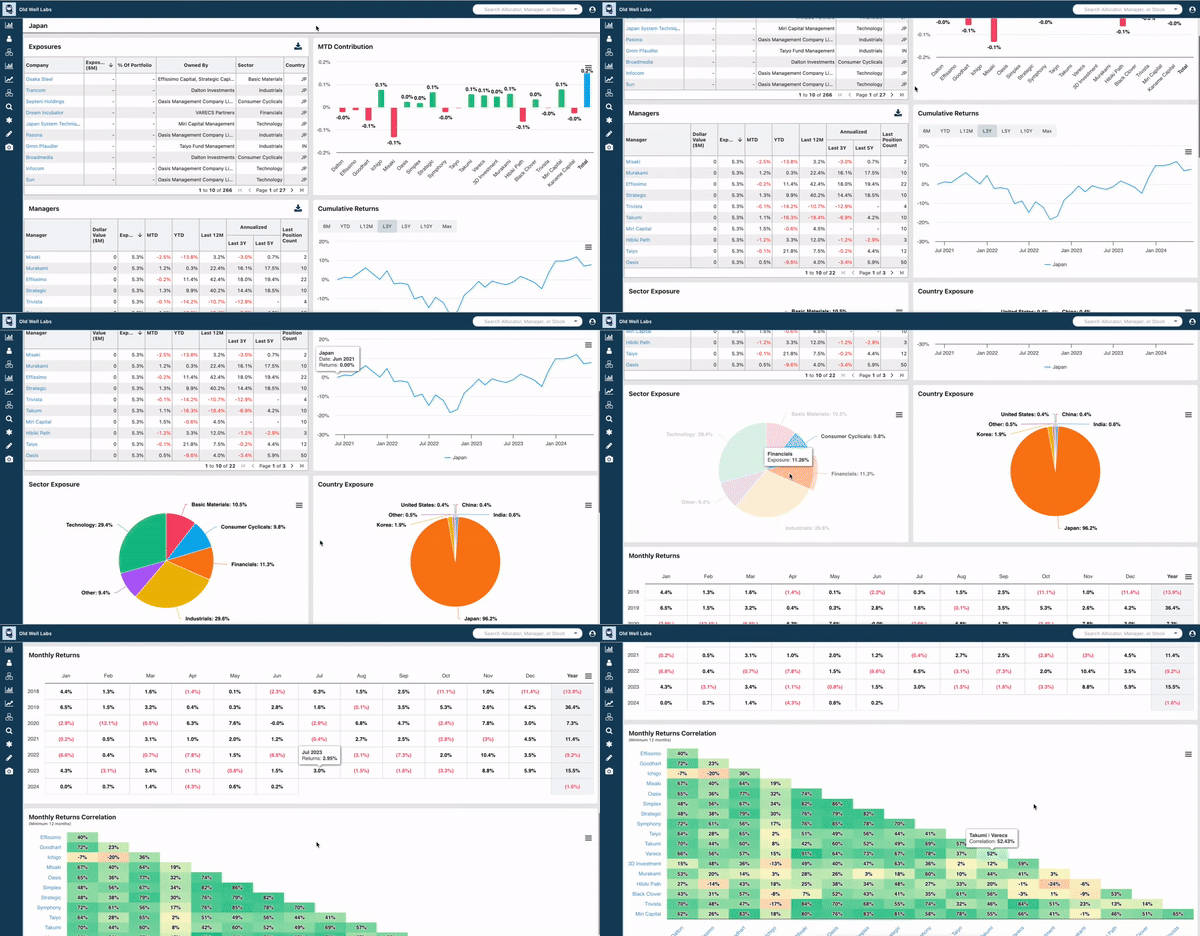
As a reminder, users can create custom groups of managers in OWL’s “My Portfolio” section in order to aggregate their returns and exposures. From a formatting perspective, we launched a significant refresh to the portfolio pages to make them faster and easier to read.
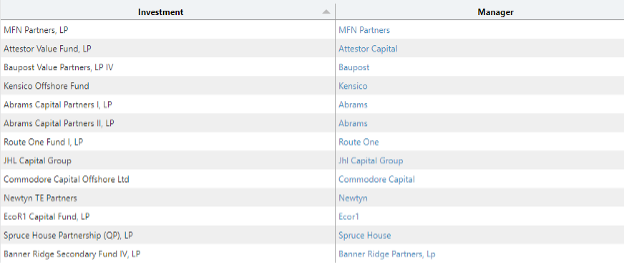
As we’ve added managers into OWL and collected more data, we’ve been able to tag more of the allocators’ holdings to managers. More than 90% of our allocator holdings are now tagged to a specific manager, up from about 30% a year ago.
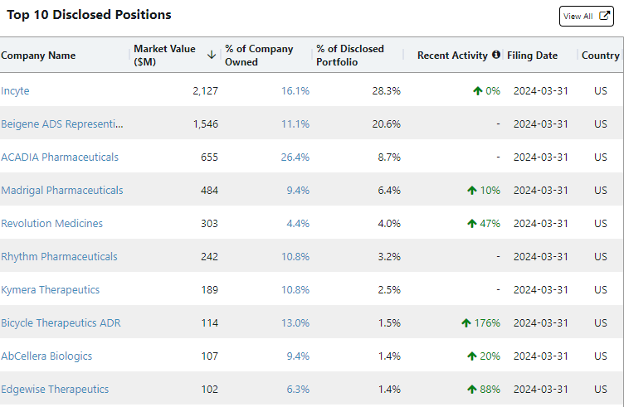
For managers with public equity positions, we simplified the portfolio snapshot that you see on the dashboard by removing a few columns and converting the “Increase”/”Decrease” tags into a column showing the manager’s recent activity in the stock:
For each manager, users can see their historical portfolio of public equity positions and how that has changed over time. For managers with a large number of positions, it can sometimes be difficult to locate a particular stock, so we added a search feature on the page that enables users to search for a company and filter the table to only show those results.

We made a number of changes to make the site faster, with some pages loading up to 80% faster than previously. In addition, we added csv, png, and svg download options to several key charts so that users can easily export the data.
We also updated formatting across a few key charts, including manager returns, in order to make them more easily readable. All returns now use the same format across the site.
April 2024
April was focused on significantly scaling the data on the platform. During the month, we added 3,386 managers, 270k positions, and nearly 300k people. At the end of the month, we had 7,325 managers in OWL.
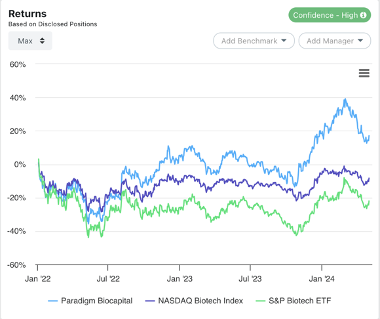
Based on user feedback, we added ‘Confidence Scores’ for OWL’s estimated manager returns. Confidence scores guide users on how likely it is that OWL's return estimate is close to the manager's actual return, based on comparing the disclosed market value of open positions against reported AUM values. As a reminder, return estimates in OWL are estimates based on disclosed longs. In many cases they are quite close, but there is a spectrum on which that falls. The confidence score shows up next to the manager return tables in OWL, as seen below, and will soon be a factor that users can filter by when using the various search tools in OWL:
Each manager’s summary section now includes tags to show the type of manager, including labels like hedge fund, private equity, or venture capital. This is just the first phase of tagging – we plan to further expand and refine these in the future, while also incorporating them into search features so that users can quickly identify and filter by the type of manager.

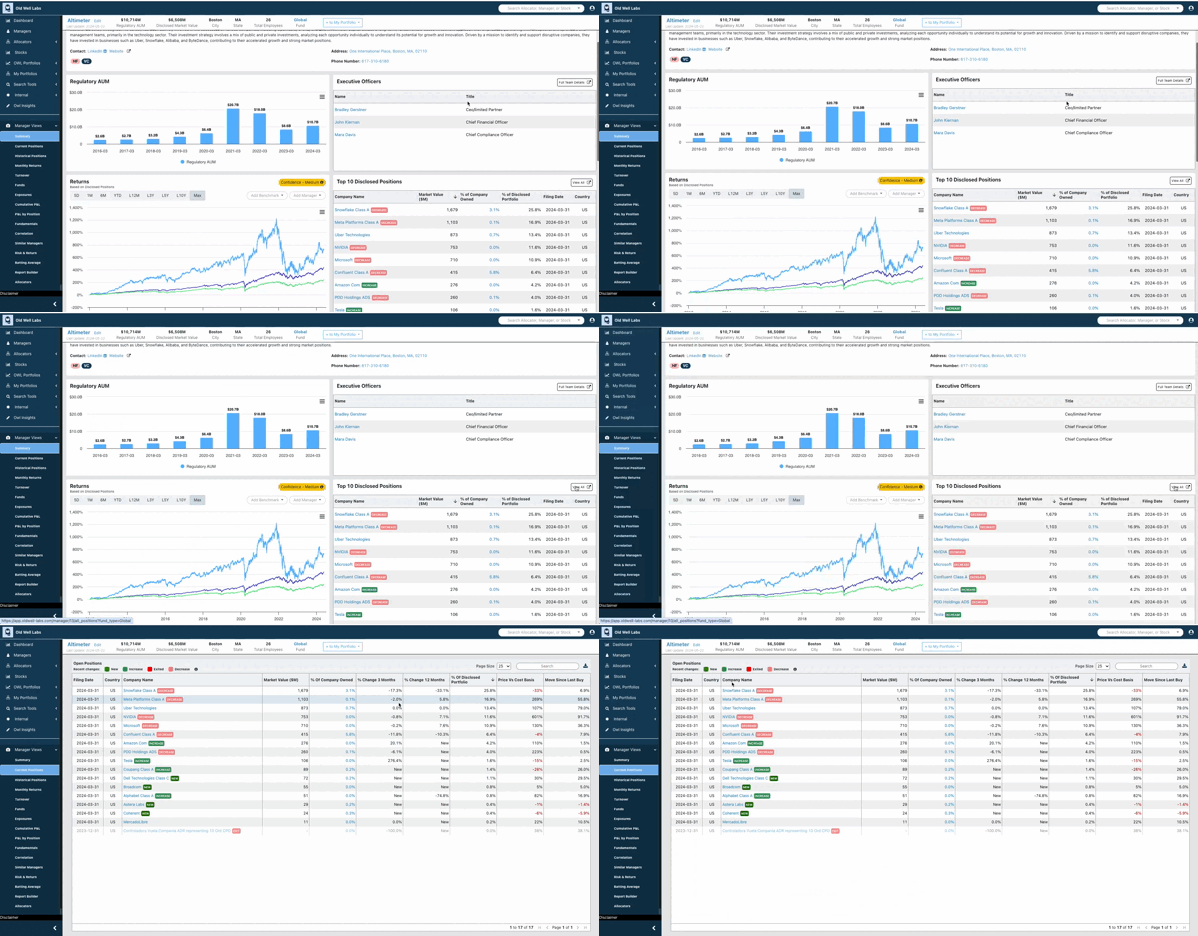
For managers that disclose public equity positions, their top 10 are a key feature of the manager dashboard. To enable users to quickly see where managers are increasing or decreasing positions, we added color-coded indicators to show recent changes. You can also click “View All” to see a manager’s entire publicly disclosed portfolio, including recently exited positions.
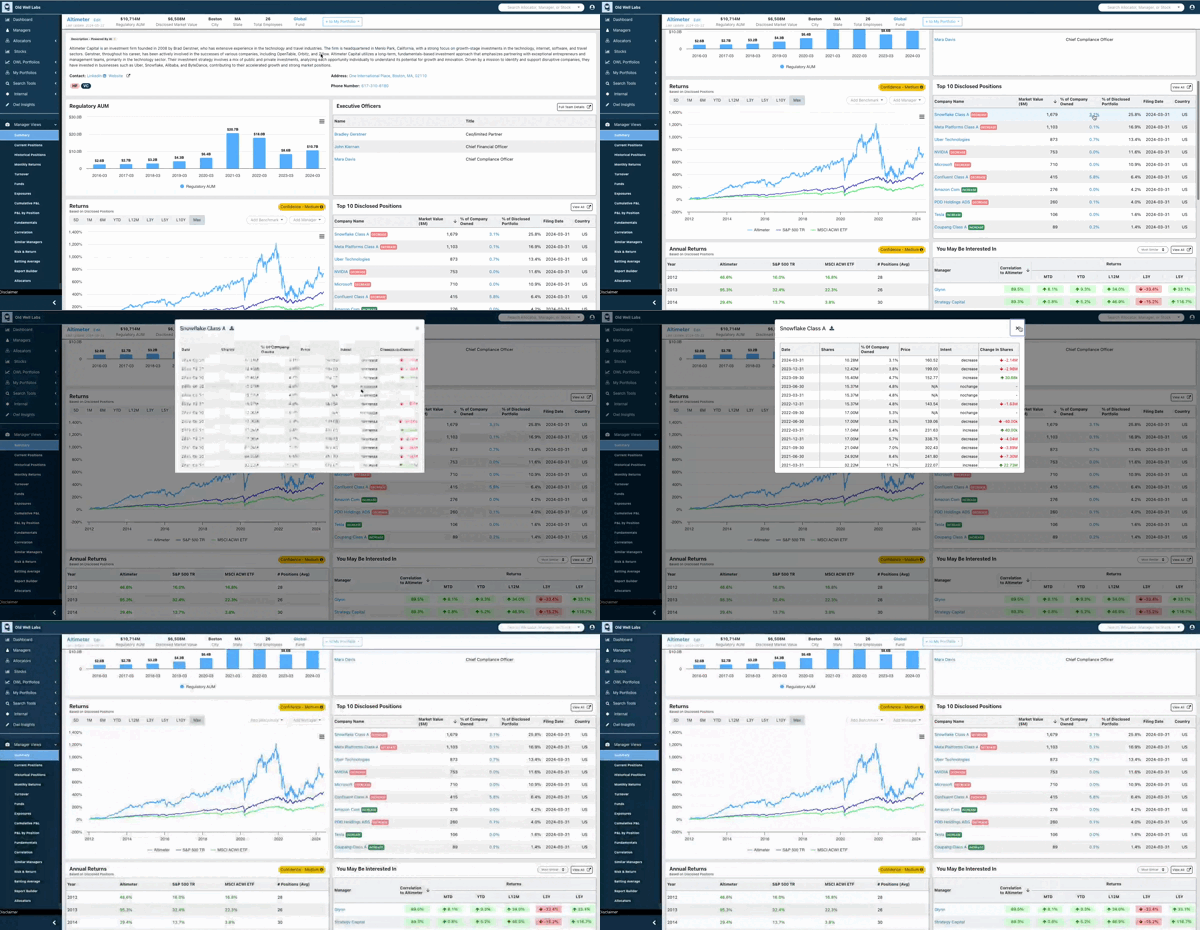
Digging a little deeper into a manager’s portfolio, for any manager position you can click in to see a full history of buys and sells, including their percentage ownership of the company over time.
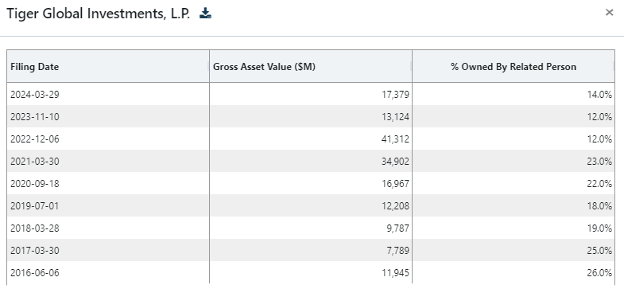
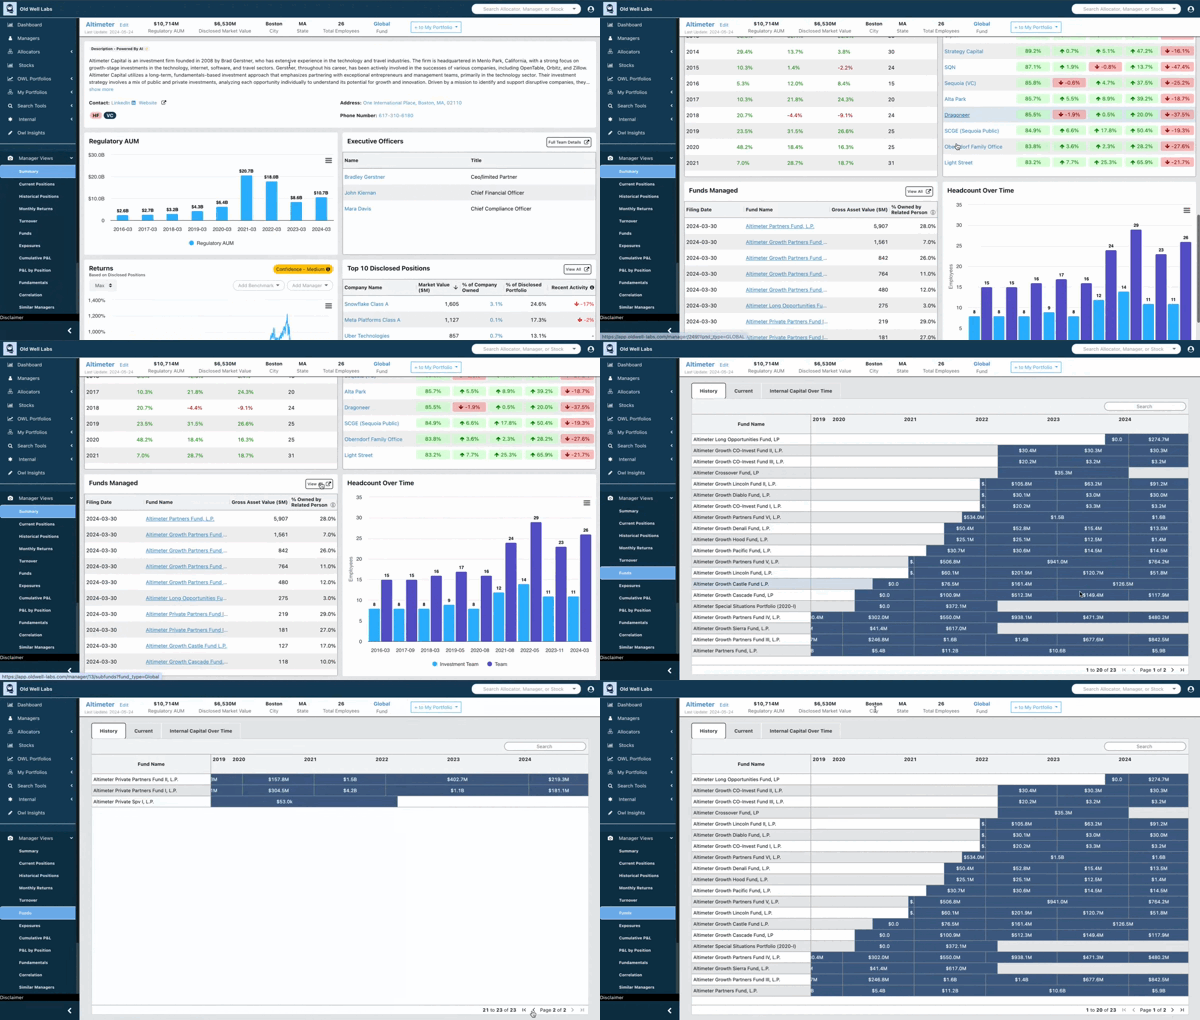
We’ve also added a few new ways to further explore the different funds each manager has, including internal ownership of each fund over time. In March, we added data showing all of the funds a given manager discloses, enabling users to see when new funds were launched or closed. In April, we added the ability to see how much of each fund is internal capital (typically defined as employees and related parties), and how that has changed over time.
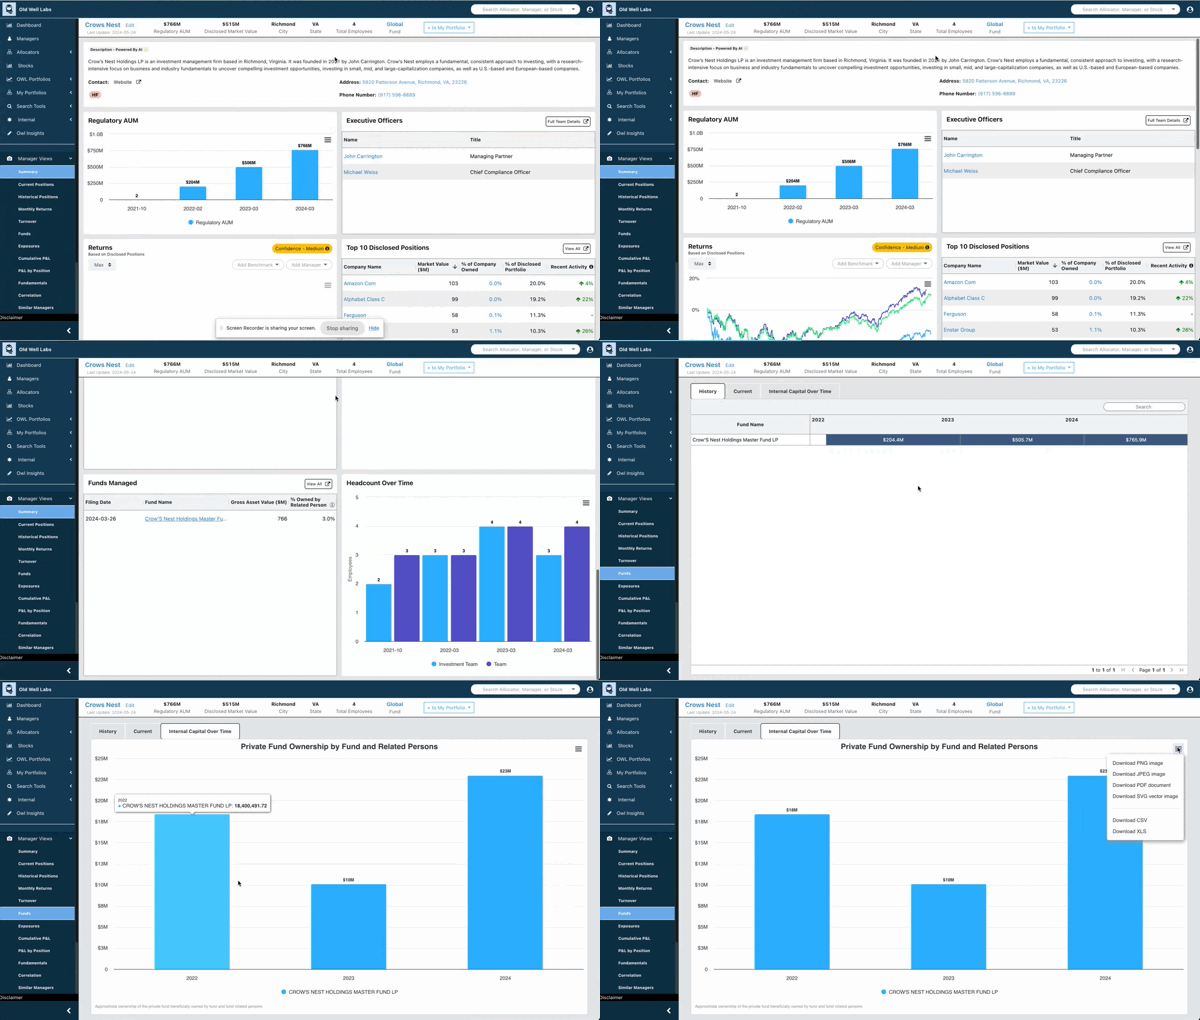
Users can also click on an individual fund and see how that internal ownership percentage has changed over time, eliminating the effect of changes in valuation.
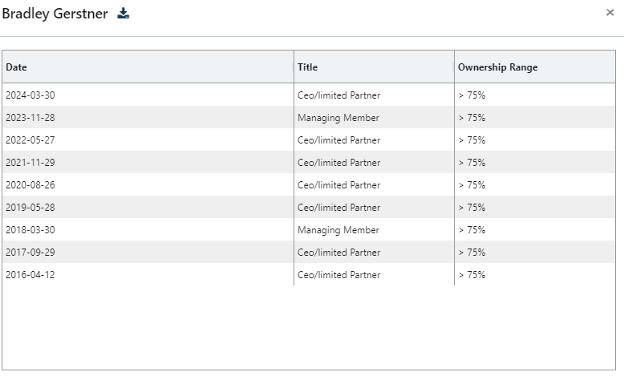
Fund managers are also required to disclose key executives on an annual basis, along with their ownership percentage of the overall firm. For any manager in our database, you can see not only the current key executives and their ownership status, but how that has changed over time:
We have made significant updates to make the location features more mobile-friendly for users that are on the go. While traveling, users can now more easily navigate the mapping features that enable them to find managers in a given location, including filters by manager type and AUM. Additionally, we added download capabilities for all tables across the site, enabling users to use and manipulate the data in ways that work for their daily workflows and processes.
March 2024
We ended March with 3,939 managers in OWL. New manager additions were primarily focused on managers that filed a 13F for the first time and additional PE/VC managers. We also cleaned up and removed ~500 entities, that, while they file some sort of disclosure of public positions, are not fund managers. Many of these were individuals in countries like Japan and India, whose positions are not relevant to our users. The net manager additions resulted in an additional 20K positions and 150k people on the platform.
In March, we also focused on mapping as many managers as possible to ADVs – following that process, 84% of managers in OWL are mapped to an ADV, enabling easy access to data like official Regulatory AUM over time and detail on funds managed by each manager.
Users now have more customization options on the manager returns chart found on each manager’s dashboard. In addition to choosing the timeframe, users can now choose custom indices, as well as add additional managers’ returns to the charts for a quick comparison.
We heard from many users that being able to search and filter managers by location was a critical part of their research process. Whether traveling to see managers or just trying to find managers in a given geography, this is important data to allocators. In March, we launched the first iteration of our location search, with additional filters and functionality to come soon. We think this feature will make planning your next trip so much easier!
In addition to the list of current funds managed by an OWL manager, users can now see how those funds have changed over time and when new funds were launched or closed. This gives allocators insight into how a manager’s business is changing and growing (or shrinking), beyond the information that they may have about a few specific funds that they are invested in:
With almost 4,000 managers in OWL (and thousands more to come!), the platform can easily provide suggestions for “similar managers” based on correlations among our estimated return streams (which, as a reminder, are based on publicly disclosed long positions). We recently re-vamped this screen to show the correlations with all managers with disclosed long positions in OWL rather than just the few most correlated, and also added the ability to customize the managers shown in the chart:
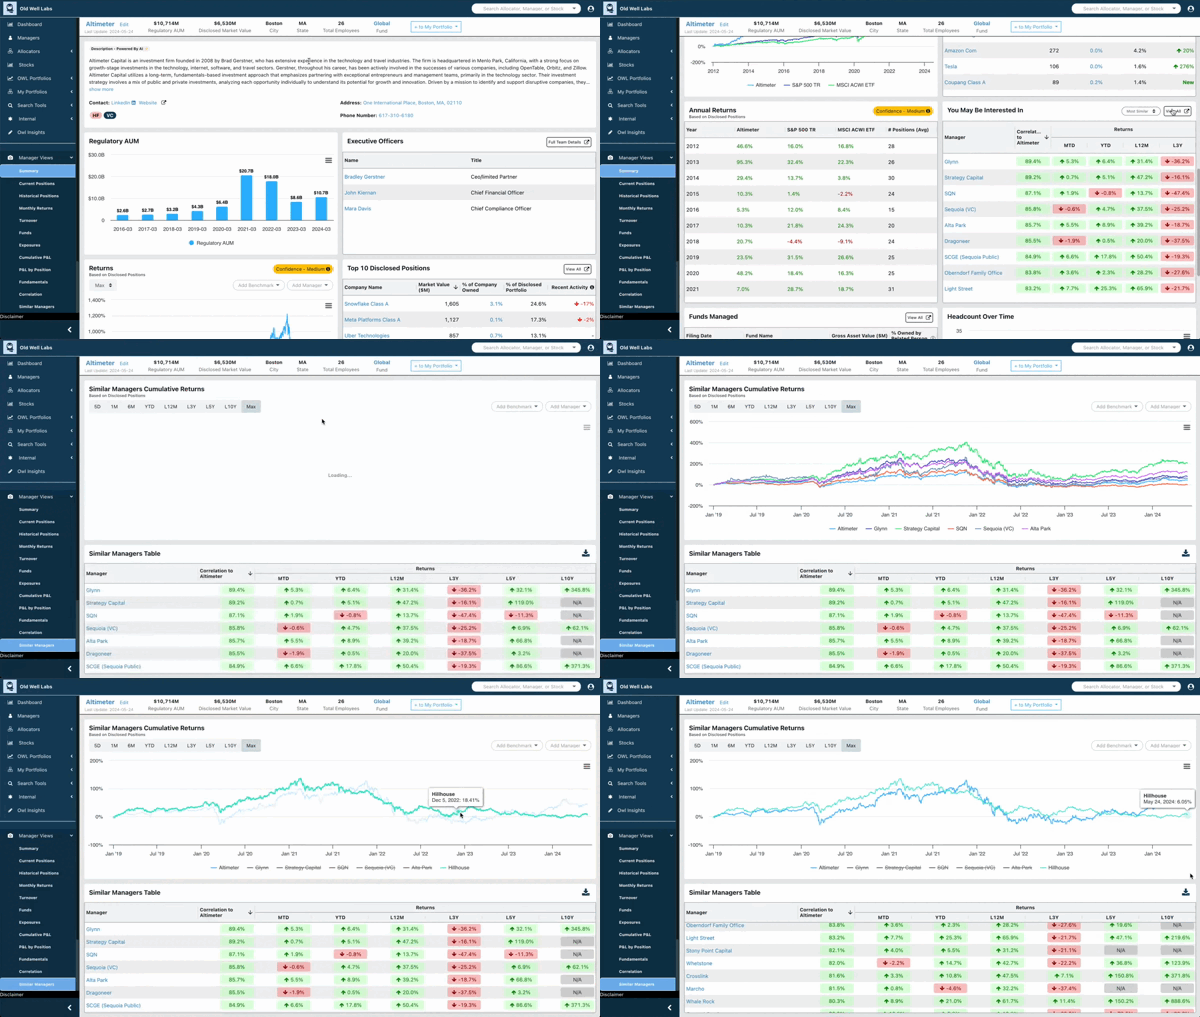
On the flip side, users can also use this feature to find managers that are least correlated with a given manager, potentially providing some portfolio diversification.
Reach out to learn how OWL can help you find, monitor, and connect with fund managers globally

